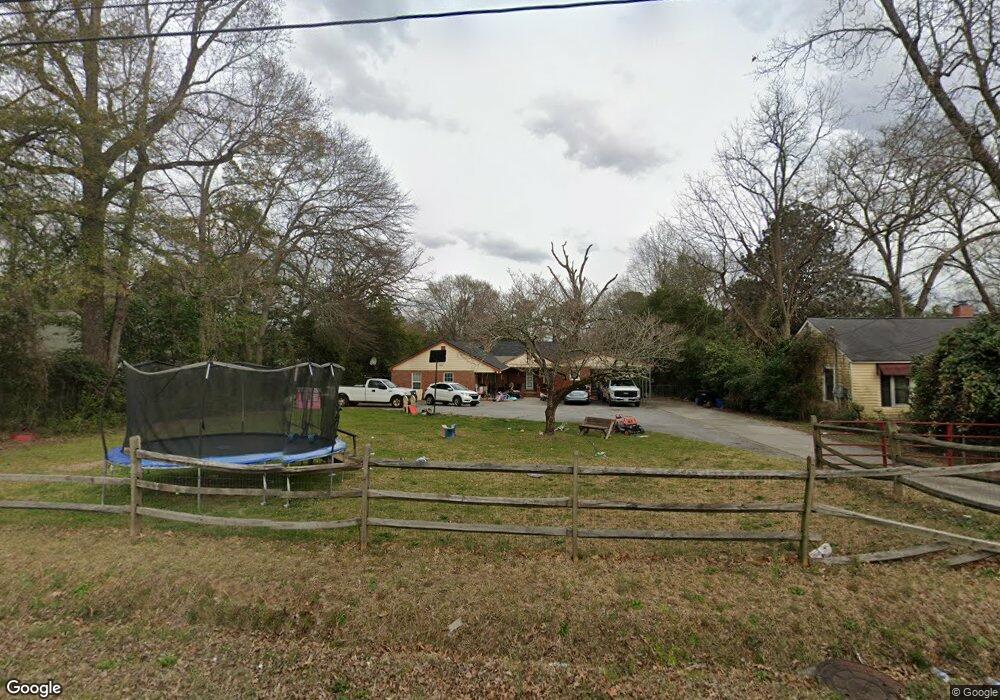
6058 Morningside Dr Columbus, GA 31909
Northern Columbus NeighborhoodEstimated Value: $240,000 - $290,000
3
Beds
4
Baths
2,470
Sq Ft
$107/Sq Ft
Est. Value
About This Home
This home is located at 6058 Morningside Dr, Columbus, GA 31909 and is currently estimated at $265,305, approximately $107 per square foot. 6058 Morningside Dr is a home located in Muscogee County with nearby schools including Gentian Elementary School, Blackmon Road Middle School, and Hardaway High School.
Ownership History
Date
Name
Owned For
Owner Type
Purchase Details
Closed on
Jun 2, 2017
Sold by
Bay Cty Invs
Bought by
Padgett Heather M
Current Estimated Value
Home Financials for this Owner
Home Financials are based on the most recent Mortgage that was taken out on this home.
Original Mortgage
$127,645
Outstanding Balance
$107,540
Interest Rate
4.5%
Mortgage Type
FHA
Estimated Equity
$157,765
Purchase Details
Closed on
Jan 27, 2017
Sold by
Paul Cathy
Bought by
Bay City Investment Grp Inc
Purchase Details
Closed on
Sep 4, 2015
Sold by
Leatherland Jay W
Bought by
Paul Cathy
Purchase Details
Closed on
Sep 2, 2008
Sold by
Leatherland Margo K
Bought by
Leatherland Jay W
Home Financials for this Owner
Home Financials are based on the most recent Mortgage that was taken out on this home.
Original Mortgage
$137,350
Interest Rate
6.15%
Mortgage Type
FHA
Create a Home Valuation Report for This Property
The Home Valuation Report is an in-depth analysis detailing your home's value as well as a comparison with similar homes in the area
Home Values in the Area
Average Home Value in this Area
Purchase History
| Date | Buyer | Sale Price | Title Company |
|---|---|---|---|
| Padgett Heather M | $130,000 | -- | |
| Bay City Investment Grp Inc | $98,500 | -- | |
| Paul Cathy | $96,700 | -- | |
| Leatherland Jay W | $139,900 | None Available |
Source: Public Records
Mortgage History
| Date | Status | Borrower | Loan Amount |
|---|---|---|---|
| Open | Padgett Heather M | $127,645 | |
| Previous Owner | Leatherland Jay W | $137,350 |
Source: Public Records
Tax History Compared to Growth
Tax History
| Year | Tax Paid | Tax Assessment Tax Assessment Total Assessment is a certain percentage of the fair market value that is determined by local assessors to be the total taxable value of land and additions on the property. | Land | Improvement |
|---|---|---|---|---|
| 2025 | $1,520 | $95,748 | $12,992 | $82,756 |
| 2024 | $1,518 | $95,748 | $12,992 | $82,756 |
| 2023 | $834 | $95,748 | $12,992 | $82,756 |
| 2022 | $1,583 | $74,704 | $12,992 | $61,712 |
| 2021 | $1,576 | $77,940 | $12,992 | $64,948 |
| 2020 | $1,577 | $77,940 | $12,992 | $64,948 |
| 2019 | $1,584 | $77,940 | $12,992 | $64,948 |
| 2018 | $1,584 | $52,000 | $8,640 | $43,360 |
| 2017 | $1,015 | $73,228 | $8,316 | $64,912 |
| 2016 | $1,020 | $37,990 | $3,808 | $34,182 |
| 2015 | $1,156 | $70,000 | $4,481 | $65,519 |
| 2014 | $2,895 | $70,000 | $4,481 | $65,519 |
| 2013 | -- | $70,000 | $4,481 | $65,519 |
Source: Public Records
Map
Nearby Homes
- 6136 Morningside Dr
- 6158 Arrington Dr
- 4454 Weems Rd
- 4320 Canady St
- 5926 Frazier Dr
- 4847 Warm Springs Rd
- 5915 Frazier Dr
- 5028 Warm Springs Rd
- 5921 Lawson St
- 5866 Morningside Dr
- 6137 Stoneway Dr
- 4627 Wimbish Ct
- 6500 Charter Oaks Cir
- 4121 Wilbur Dr
- 5623 Hodges Dr
- 6104 Candlestick Loop
- 4245 N Oaks Dr
- 5619 Hodges Dr
- 5045 Old Post Rd
- 5042 Foxfire Dr
- 6052 Morningside Dr
- 6064 Morningside Dr
- 6070 Morningside Dr
- 6046 Morningside Dr
- 6074 Morningside Dr
- 6040 Morningside Dr
- 6110 Morningside Dr
- 6049 Warner Rd
- 6030 Morningside Dr
- 6031 Morningside Dr
- 6115 Warner Rd
- 6041 Warner Rd
- 6116 Morningside Dr
- 6024 Morningside Dr
- 6111 Warner Rd
- 6113 Warner Rd
- 6023 Morningside Dr
- 6123 Warner Rd
- 6035 Warner Rd
- 6109 Morningside Dr