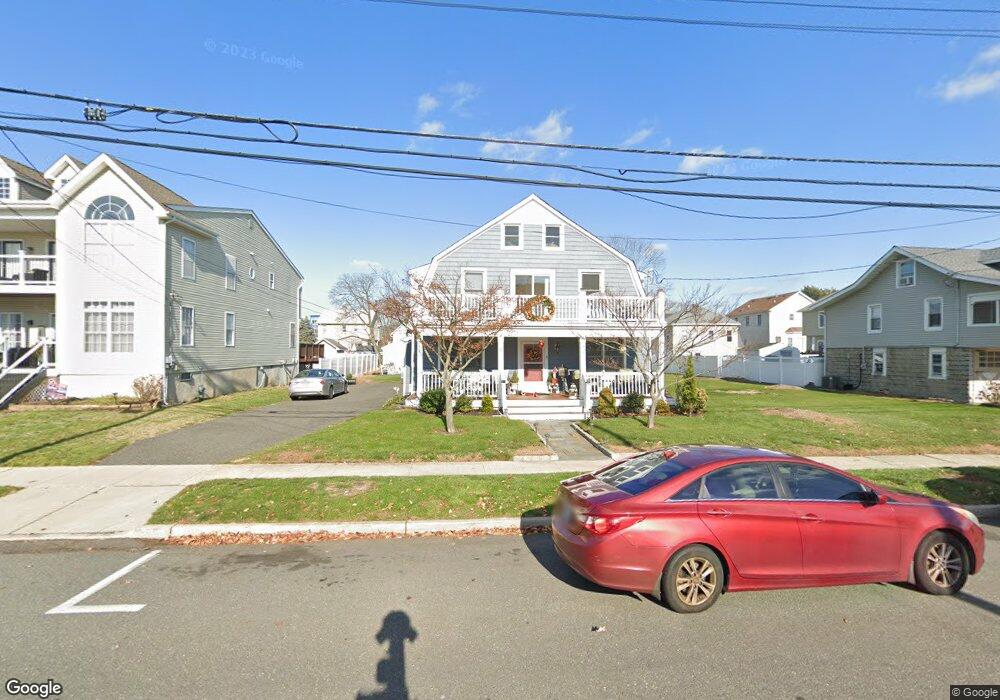
606 11th Ave Belmar, NJ 07719
Estimated Value: $927,000 - $1,504,000
4
Beds
2
Baths
3,570
Sq Ft
$369/Sq Ft
Est. Value
About This Home
This home is located at 606 11th Ave, Belmar, NJ 07719 and is currently estimated at $1,318,804, approximately $369 per square foot. 606 11th Ave is a home located in Monmouth County with nearby schools including Belmar Elementary School, St. Rose Grammar School, and St Rose High School.
Ownership History
Date
Name
Owned For
Owner Type
Purchase Details
Closed on
Dec 16, 2016
Sold by
Daniele Pete and Daniele Linda
Bought by
Daniele Pete and Daniele Linda
Current Estimated Value
Purchase Details
Closed on
Oct 28, 2015
Sold by
Deutsche Bank National Trust Co
Bought by
Daniels Pete and Daniels Linda
Purchase Details
Closed on
Nov 21, 2014
Sold by
Hawkins Benjamin C
Bought by
Deutsche Bank National Trust Co
Create a Home Valuation Report for This Property
The Home Valuation Report is an in-depth analysis detailing your home's value as well as a comparison with similar homes in the area
Home Values in the Area
Average Home Value in this Area
Purchase History
| Date | Buyer | Sale Price | Title Company |
|---|---|---|---|
| Daniele Pete | -- | None Available | |
| Daniele Pete | -- | None Available | |
| Daniels Pete | $423,000 | None Available | |
| Deutsche Bank National Trust Co | -- | Terra Abstract Inc |
Source: Public Records
Tax History Compared to Growth
Tax History
| Year | Tax Paid | Tax Assessment Tax Assessment Total Assessment is a certain percentage of the fair market value that is determined by local assessors to be the total taxable value of land and additions on the property. | Land | Improvement |
|---|---|---|---|---|
| 2025 | $10,521 | $723,100 | $395,000 | $328,100 |
| 2024 | $10,167 | $723,100 | $395,000 | $328,100 |
| 2023 | $10,167 | $723,100 | $395,000 | $328,100 |
| 2022 | $9,812 | $723,100 | $395,000 | $328,100 |
| 2021 | $9,614 | $723,100 | $395,000 | $328,100 |
| 2020 | $9,614 | $714,800 | $395,000 | $319,800 |
| 2019 | $9,614 | $714,800 | $395,000 | $319,800 |
| 2018 | $8,828 | $714,800 | $395,000 | $319,800 |
| 2017 | $9,577 | $794,800 | $475,000 | $319,800 |
| 2016 | $10,184 | $532,900 | $305,000 | $227,900 |
| 2015 | $10,514 | $547,900 | $320,000 | $227,900 |
| 2014 | $10,215 | $527,900 | $300,000 | $227,900 |
Source: Public Records
Map
Nearby Homes