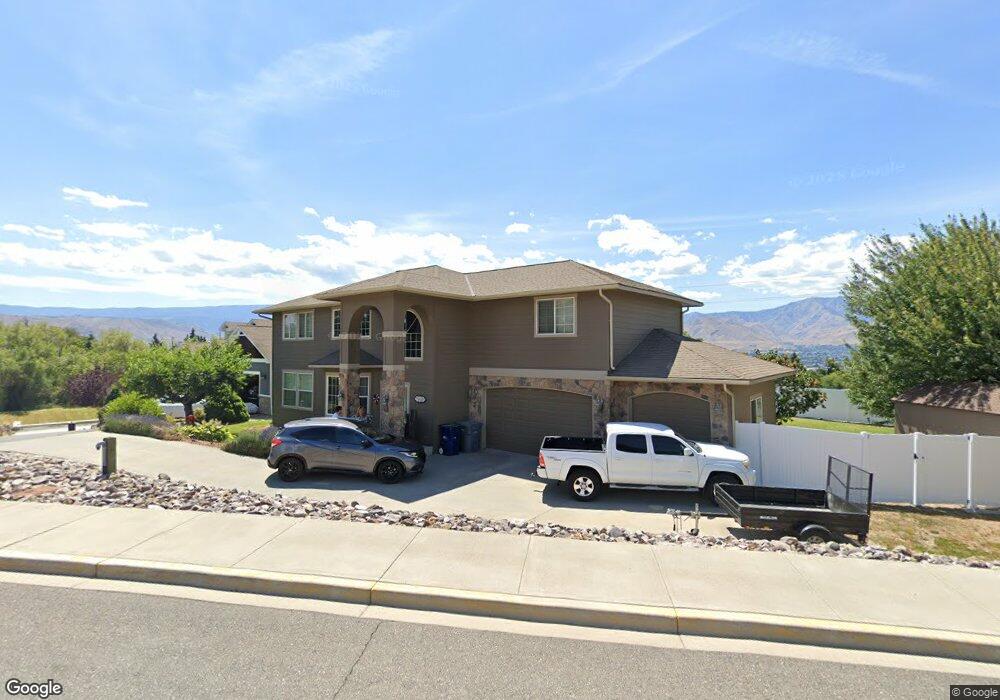
606 19th St NE East Wenatchee, WA 98802
Estimated Value: $729,000 - $1,047,000
3
Beds
3
Baths
2,854
Sq Ft
$306/Sq Ft
Est. Value
About This Home
This home is located at 606 19th St NE, East Wenatchee, WA 98802 and is currently estimated at $871,992, approximately $305 per square foot. 606 19th St NE is a home located in Douglas County with nearby schools including Lee Elementary School, Sterling Intermediate School, and Eastmont Junior High School.
Ownership History
Date
Name
Owned For
Owner Type
Purchase Details
Closed on
Feb 22, 2006
Sold by
Edwin A Noyes Family Lp
Bought by
Porter Tony and Porter Deanna
Current Estimated Value
Home Financials for this Owner
Home Financials are based on the most recent Mortgage that was taken out on this home.
Original Mortgage
$248,400
Outstanding Balance
$138,594
Interest Rate
6.05%
Mortgage Type
Adjustable Rate Mortgage/ARM
Estimated Equity
$733,398
Purchase Details
Closed on
Oct 4, 2005
Sold by
Noyes Eldon
Bought by
Noyes Edwin A
Purchase Details
Closed on
Sep 22, 2005
Sold by
Peach Haven Estates Inc
Bought by
Shank Ricahrd and Shank Louise
Purchase Details
Closed on
Sep 13, 2005
Sold by
Shank Steve and Shank Deborah
Bought by
Noyes Eldon
Create a Home Valuation Report for This Property
The Home Valuation Report is an in-depth analysis detailing your home's value as well as a comparison with similar homes in the area
Home Values in the Area
Average Home Value in this Area
Purchase History
| Date | Buyer | Sale Price | Title Company |
|---|---|---|---|
| Porter Tony | -- | None Available | |
| Noyes Edwin A | -- | None Available | |
| Shank Ricahrd | -- | None Available | |
| Noyes Eldon | $57,000 | None Available |
Source: Public Records
Mortgage History
| Date | Status | Borrower | Loan Amount |
|---|---|---|---|
| Open | Porter Tony | $248,400 |
Source: Public Records
Tax History Compared to Growth
Tax History
| Year | Tax Paid | Tax Assessment Tax Assessment Total Assessment is a certain percentage of the fair market value that is determined by local assessors to be the total taxable value of land and additions on the property. | Land | Improvement |
|---|---|---|---|---|
| 2025 | $5,712 | $686,900 | $135,000 | $551,900 |
| 2024 | $5,712 | $687,000 | $135,000 | $552,000 |
| 2023 | $5,829 | $602,300 | $117,000 | $485,300 |
| 2022 | $5,566 | $532,600 | $99,000 | $433,600 |
| 2021 | $5,401 | $532,600 | $99,000 | $433,600 |
| 2020 | $4,920 | $476,000 | $99,000 | $377,000 |
| 2018 | $4,549 | $393,800 | $79,200 | $314,600 |
| 2017 | $3,941 | $393,800 | $79,200 | $314,600 |
| 2016 | $3,402 | $370,200 | $72,000 | $298,200 |
| 2015 | $3,549 | $305,000 | $72,000 | $233,000 |
| 2014 | -- | $305,000 | $72,000 | $233,000 |
| 2013 | -- | $305,000 | $72,000 | $233,000 |
Source: Public Records
Map
Nearby Homes
- 1992 Stoneridge Dr
- 606 Ski View Dr
- 1653 Holly Ln
- 351 19th St NE Unit 26
- 351 19th St NE Unit 21
- 1840 Country Club Dr
- 710 NE Tyler Place
- 705 NE Tyler Place
- 225 19th St NE Unit 31
- 225 19th St NE Unit 23
- 902 NE Tyler Place
- 760 NE Tyler Place
- 946 Briarwood Dr
- 1494 Eastmont Ave Unit 56
- 1494 Eastmont Ave Unit 33
- 0 Mountain View Dr
- 2327 Grand Ave
- 326 23rd St NE
- 1352 Eastmont Ave Unit 15
- 3234 NW Chadwick (Lot 25) Loop
- 608 19th St NE
- 605 19th St NE
- 601 19th St NE
- 609 19th St NE
- 612 19th St NE
- 610 19th St NE
- 613 19th St NE
- 1928 Eastmont Ave
- 1929 Eastmont Ave
- 595 King Place
- 614 19th St NE
- 615 19th St NE
- 608 Skiview Place
- 1920 Eastmont Ave
- 614 Skiview Place
- 1931 Eastmont Ave
- 602 Skiview Place
- 1932 Eastmont Ave
- 1910 Eastmont Ave
- 1979 Peach Haven Ct