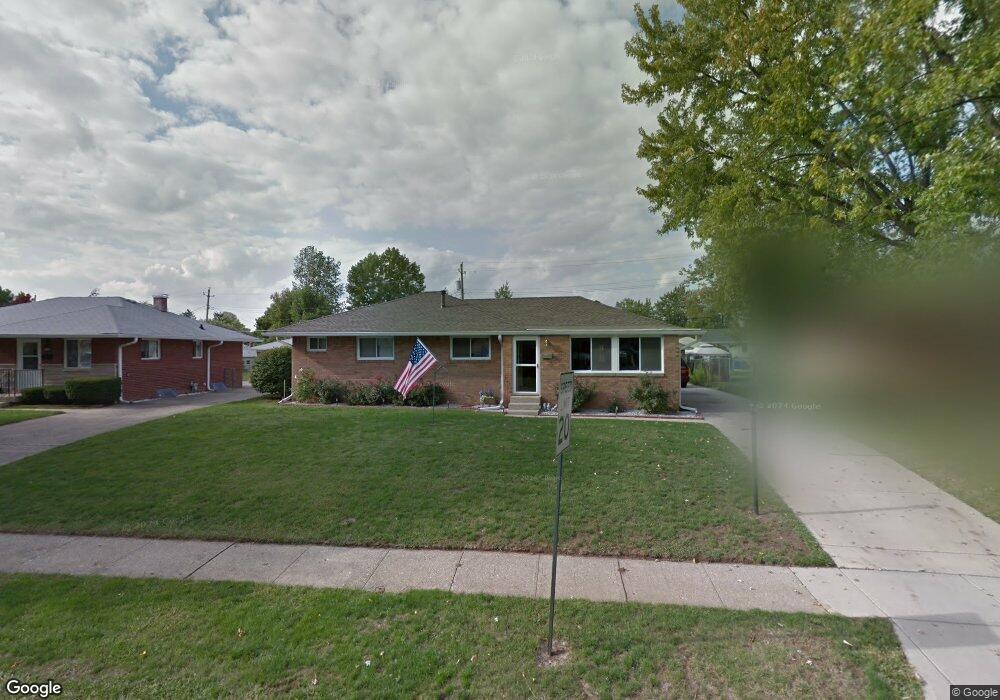
606 Ash St Beech Grove, IN 46107
Estimated Value: $240,000 - $282,672
4
Beds
3
Baths
2,824
Sq Ft
$90/Sq Ft
Est. Value
About This Home
This home is located at 606 Ash St, Beech Grove, IN 46107 and is currently estimated at $254,668, approximately $90 per square foot. 606 Ash St is a home located in Marion County with nearby schools including Hornet Park Elementary School, South Grove Intermediate School, and Central Elementary School.
Ownership History
Date
Name
Owned For
Owner Type
Purchase Details
Closed on
Mar 14, 2005
Sold by
Holwager Margret Jean
Bought by
Merl Samluel U and Merl Cynthia K
Current Estimated Value
Home Financials for this Owner
Home Financials are based on the most recent Mortgage that was taken out on this home.
Original Mortgage
$98,400
Interest Rate
5.71%
Mortgage Type
New Conventional
Create a Home Valuation Report for This Property
The Home Valuation Report is an in-depth analysis detailing your home's value as well as a comparison with similar homes in the area
Home Values in the Area
Average Home Value in this Area
Purchase History
| Date | Buyer | Sale Price | Title Company |
|---|---|---|---|
| Merl Samluel U | -- | None Available |
Source: Public Records
Mortgage History
| Date | Status | Borrower | Loan Amount |
|---|---|---|---|
| Previous Owner | Merl Samluel U | $98,400 |
Source: Public Records
Tax History Compared to Growth
Tax History
| Year | Tax Paid | Tax Assessment Tax Assessment Total Assessment is a certain percentage of the fair market value that is determined by local assessors to be the total taxable value of land and additions on the property. | Land | Improvement |
|---|---|---|---|---|
| 2024 | $2,982 | $247,500 | $21,400 | $226,100 |
| 2023 | $2,982 | $226,100 | $21,400 | $204,700 |
| 2022 | $2,844 | $199,900 | $21,400 | $178,500 |
| 2021 | $2,249 | $166,200 | $21,400 | $144,800 |
| 2020 | $1,901 | $150,200 | $21,400 | $128,800 |
| 2019 | $1,757 | $144,100 | $14,100 | $130,000 |
| 2018 | $1,533 | $130,700 | $14,100 | $116,600 |
| 2017 | $1,500 | $125,000 | $14,100 | $110,900 |
| 2016 | $1,451 | $122,200 | $14,100 | $108,100 |
| 2014 | $1,293 | $115,000 | $14,100 | $100,900 |
| 2013 | $1,195 | $107,000 | $14,100 | $92,900 |
Source: Public Records
Map
Nearby Homes