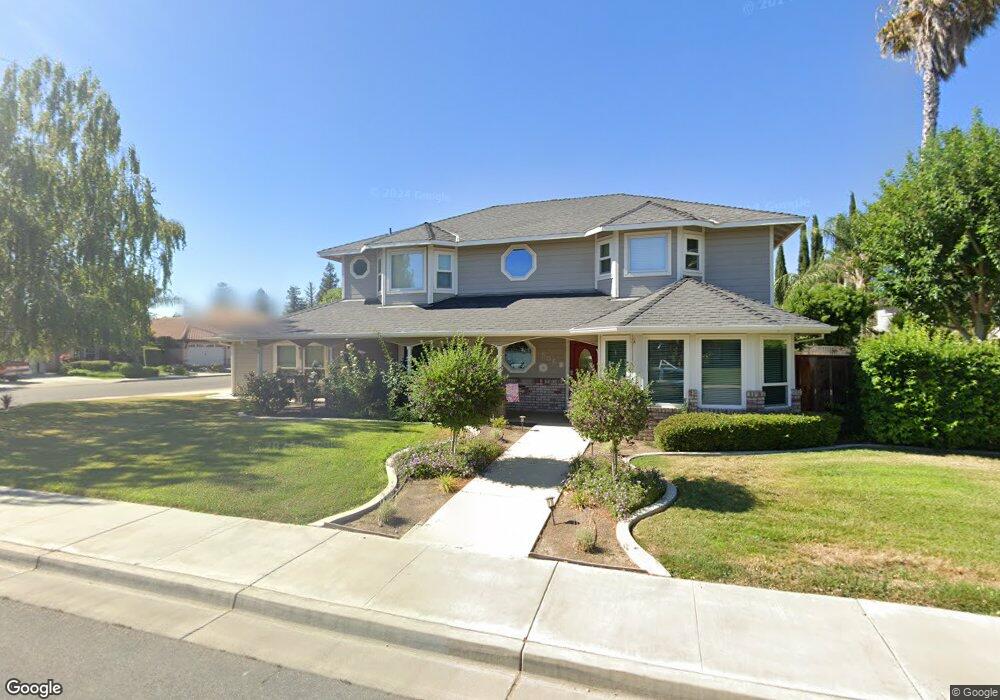
606 Bluff Dr Los Banos, CA 93635
Estimated Value: $544,000 - $622,000
3
Beds
3
Baths
2,410
Sq Ft
$239/Sq Ft
Est. Value
About This Home
This home is located at 606 Bluff Dr, Los Banos, CA 93635 and is currently estimated at $575,918, approximately $238 per square foot. 606 Bluff Dr is a home located in Merced County with nearby schools including Los Banos Elementary School, Creekside Junior High School, and Los Banos High School.
Ownership History
Date
Name
Owned For
Owner Type
Purchase Details
Closed on
Nov 20, 2019
Sold by
Hunter Alyce L
Bought by
Hunter Alyce and Alyce Hunter 2019 Trust
Current Estimated Value
Purchase Details
Closed on
Jul 19, 2005
Sold by
Hunter William C and Hunter Alyce
Bought by
Hunter William C and Hunter Alyce L
Home Financials for this Owner
Home Financials are based on the most recent Mortgage that was taken out on this home.
Original Mortgage
$35,000
Interest Rate
5.56%
Mortgage Type
New Conventional
Create a Home Valuation Report for This Property
The Home Valuation Report is an in-depth analysis detailing your home's value as well as a comparison with similar homes in the area
Home Values in the Area
Average Home Value in this Area
Purchase History
| Date | Buyer | Sale Price | Title Company |
|---|---|---|---|
| Hunter Alyce | -- | None Available | |
| Hunter William C | -- | Alliance Title Company |
Source: Public Records
Mortgage History
| Date | Status | Borrower | Loan Amount |
|---|---|---|---|
| Closed | Hunter William C | $35,000 |
Source: Public Records
Tax History
| Year | Tax Paid | Tax Assessment Tax Assessment Total Assessment is a certain percentage of the fair market value that is determined by local assessors to be the total taxable value of land and additions on the property. | Land | Improvement |
|---|---|---|---|---|
| 2025 | $4,098 | $352,755 | $87,521 | $265,234 |
| 2024 | $4,098 | $345,839 | $85,805 | $260,034 |
| 2023 | $3,859 | $339,059 | $84,123 | $254,936 |
| 2022 | $3,783 | $332,412 | $82,474 | $249,938 |
| 2021 | $3,727 | $325,895 | $80,857 | $245,038 |
| 2020 | $3,679 | $322,554 | $80,028 | $242,526 |
| 2019 | $3,610 | $316,230 | $78,459 | $237,771 |
| 2018 | $3,502 | $310,030 | $76,921 | $233,109 |
| 2017 | $3,458 | $303,952 | $75,413 | $228,539 |
| 2016 | $3,494 | $297,993 | $73,935 | $224,058 |
| 2015 | $3,424 | $293,518 | $72,825 | $220,693 |
| 2014 | $2,710 | $232,000 | $30,000 | $202,000 |
Source: Public Records
Map
Nearby Homes
- 709 Madison Ave
- 652 Pinelli Dr
- 454 Pinelli Dr
- 541 Pinelli Dr
- 433 Pinelli Dr
- 20058 Cardoza Rd
- 664 Amabile Dr
- 708 Coastal Ct
- 2013 Marcicocchi Ct
- 2135 Arroyo Ct
- 0 W Pacheco Blvd Unit MC25270249
- 2126 Mckinley Ct
- 1043 Adams Ave
- 1032 9th St
- 1062 Madison Ave
- 506 M St
- 1502 Paradise Ln
- 820 J St
- 1257 Arizona Ave
- 631 I St
Your Personal Tour Guide
Ask me questions while you tour the home.