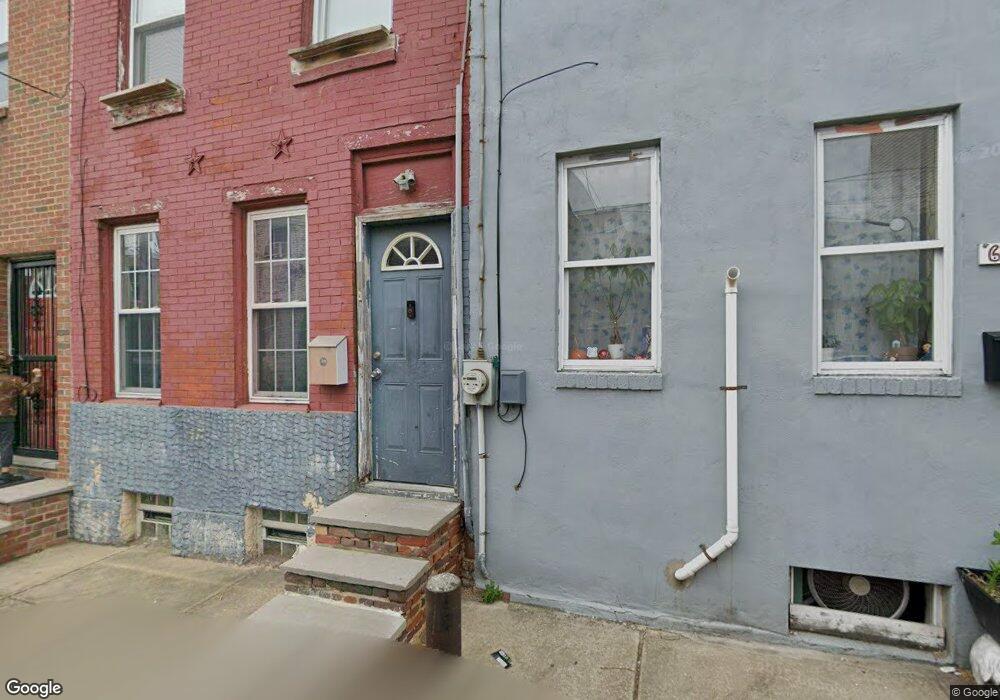
606 Cantrell St Philadelphia, PA 19148
South Philadelphia East NeighborhoodEstimated Value: $235,000 - $266,000
3
Beds
1
Bath
1,064
Sq Ft
$237/Sq Ft
Est. Value
About This Home
This home is located at 606 Cantrell St, Philadelphia, PA 19148 and is currently estimated at $251,667, approximately $236 per square foot. 606 Cantrell St is a home located in Philadelphia County with nearby schools including South Philadelphia High School, Key Francis Scott School, and Our Lady of Hope.
Ownership History
Date
Name
Owned For
Owner Type
Purchase Details
Closed on
Apr 30, 2007
Sold by
Sengkeo Kham
Bought by
Porter Kevin Shawn
Current Estimated Value
Home Financials for this Owner
Home Financials are based on the most recent Mortgage that was taken out on this home.
Original Mortgage
$102,600
Interest Rate
6.73%
Mortgage Type
Purchase Money Mortgage
Purchase Details
Closed on
Oct 20, 2005
Sold by
Tang Peihong
Bought by
Sengkeo Kham
Purchase Details
Closed on
Jun 10, 2005
Sold by
Us Bank Na
Bought by
Tang Peihong
Purchase Details
Closed on
May 31, 2005
Sold by
Cain Eula
Bought by
Us Bank Na and City Space Home Equity Loan Tr 1997-B
Purchase Details
Closed on
Feb 20, 1997
Sold by
Cain Irene
Bought by
Cain Eula
Create a Home Valuation Report for This Property
The Home Valuation Report is an in-depth analysis detailing your home's value as well as a comparison with similar homes in the area
Home Values in the Area
Average Home Value in this Area
Purchase History
| Date | Buyer | Sale Price | Title Company |
|---|---|---|---|
| Porter Kevin Shawn | $114,000 | None Available | |
| Sengkeo Kham | $40,500 | Security Search & Abstract C | |
| Tang Peihong | $27,800 | None Available | |
| Us Bank Na | $20,000 | None Available | |
| Cain Eula | -- | -- |
Source: Public Records
Mortgage History
| Date | Status | Borrower | Loan Amount |
|---|---|---|---|
| Previous Owner | Porter Kevin Shawn | $102,600 |
Source: Public Records
Tax History Compared to Growth
Tax History
| Year | Tax Paid | Tax Assessment Tax Assessment Total Assessment is a certain percentage of the fair market value that is determined by local assessors to be the total taxable value of land and additions on the property. | Land | Improvement |
|---|---|---|---|---|
| 2026 | $3,326 | $259,200 | $51,840 | $207,360 |
| 2025 | $3,326 | $259,200 | $51,840 | $207,360 |
| 2024 | $3,326 | $259,200 | $51,840 | $207,360 |
| 2023 | $3,326 | $237,600 | $47,520 | $190,080 |
| 2022 | $3,049 | $192,600 | $47,520 | $145,080 |
| 2021 | $3,679 | $0 | $0 | $0 |
| 2020 | $3,679 | $0 | $0 | $0 |
| 2019 | $3,395 | $0 | $0 | $0 |
| 2018 | $680 | $0 | $0 | $0 |
| 2017 | $1,100 | $0 | $0 | $0 |
| 2016 | $680 | $0 | $0 | $0 |
| 2015 | $651 | $0 | $0 | $0 |
| 2014 | -- | $78,600 | $10,013 | $68,587 |
| 2012 | -- | $3,840 | $338 | $3,502 |
Source: Public Records
Map
Nearby Homes