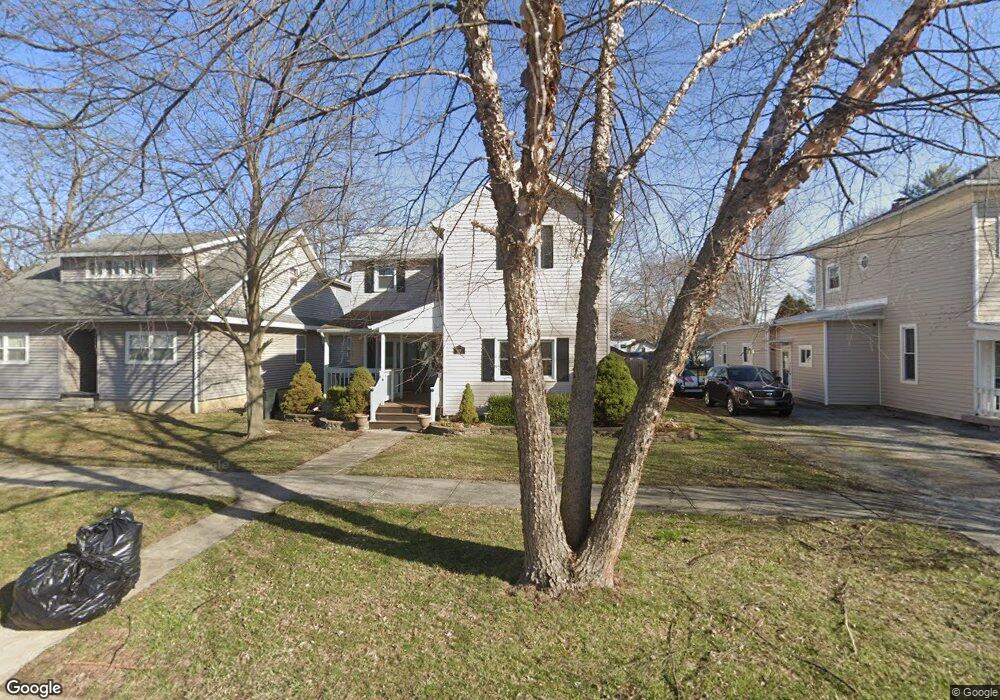
606 Cherry St Findlay, OH 45840
Estimated Value: $159,000 - $174,000
3
Beds
2
Baths
1,600
Sq Ft
$104/Sq Ft
Est. Value
About This Home
This home is located at 606 Cherry St, Findlay, OH 45840 and is currently estimated at $165,975, approximately $103 per square foot. 606 Cherry St is a home located in Hancock County with nearby schools including Whittier Elementary School, Wilson Vance Elementary School, and Donnell Middle School.
Ownership History
Date
Name
Owned For
Owner Type
Purchase Details
Closed on
Jun 29, 1999
Sold by
Fenton Jack
Bought by
Fenton John and Fenton Nicole
Current Estimated Value
Home Financials for this Owner
Home Financials are based on the most recent Mortgage that was taken out on this home.
Original Mortgage
$10,000
Outstanding Balance
$2,710
Interest Rate
7.15%
Mortgage Type
New Conventional
Estimated Equity
$163,265
Create a Home Valuation Report for This Property
The Home Valuation Report is an in-depth analysis detailing your home's value as well as a comparison with similar homes in the area
Home Values in the Area
Average Home Value in this Area
Purchase History
| Date | Buyer | Sale Price | Title Company |
|---|---|---|---|
| Fenton John | $65,000 | -- |
Source: Public Records
Mortgage History
| Date | Status | Borrower | Loan Amount |
|---|---|---|---|
| Open | Fenton John | $10,000 |
Source: Public Records
Tax History
| Year | Tax Paid | Tax Assessment Tax Assessment Total Assessment is a certain percentage of the fair market value that is determined by local assessors to be the total taxable value of land and additions on the property. | Land | Improvement |
|---|---|---|---|---|
| 2024 | $1,575 | $44,310 | $4,970 | $39,340 |
| 2023 | $1,577 | $44,310 | $4,970 | $39,340 |
| 2022 | $1,572 | $44,310 | $4,970 | $39,340 |
| 2021 | $1,412 | $34,670 | $5,240 | $29,430 |
| 2020 | $1,383 | $33,980 | $5,240 | $28,740 |
| 2019 | $1,355 | $33,980 | $5,240 | $28,740 |
| 2018 | $1,292 | $29,730 | $4,550 | $25,180 |
| 2017 | $646 | $29,730 | $4,550 | $25,180 |
| 2016 | $1,282 | $29,730 | $4,550 | $25,180 |
| 2015 | $1,016 | $23,230 | $4,550 | $18,680 |
| 2014 | $1,016 | $23,230 | $4,550 | $18,680 |
| 2012 | $1,024 | $23,230 | $4,550 | $18,680 |
Source: Public Records
Map
Nearby Homes
- 640 Center St
- 523 Center St
- 439 Carnahan Ave
- 655 Clinton Ct
- 810 Mcconnell St
- 741 Central Ave
- 1020 Country Club Dr
- 213 Cherry St
- 125 Cherry St
- 207 Ash Ave
- 1125 Glen Meadow Dr
- 204 Laquineo St
- 1308 Greendale Ave
- 1209 Heather Dr
- 716 Winfield Ave
- 912 Parkside Place
- 1001 Decker Ave
- 309 Huron Rd
- 322 Midland Ave
- 706 N Cory St
Your Personal Tour Guide
Ask me questions while you tour the home.