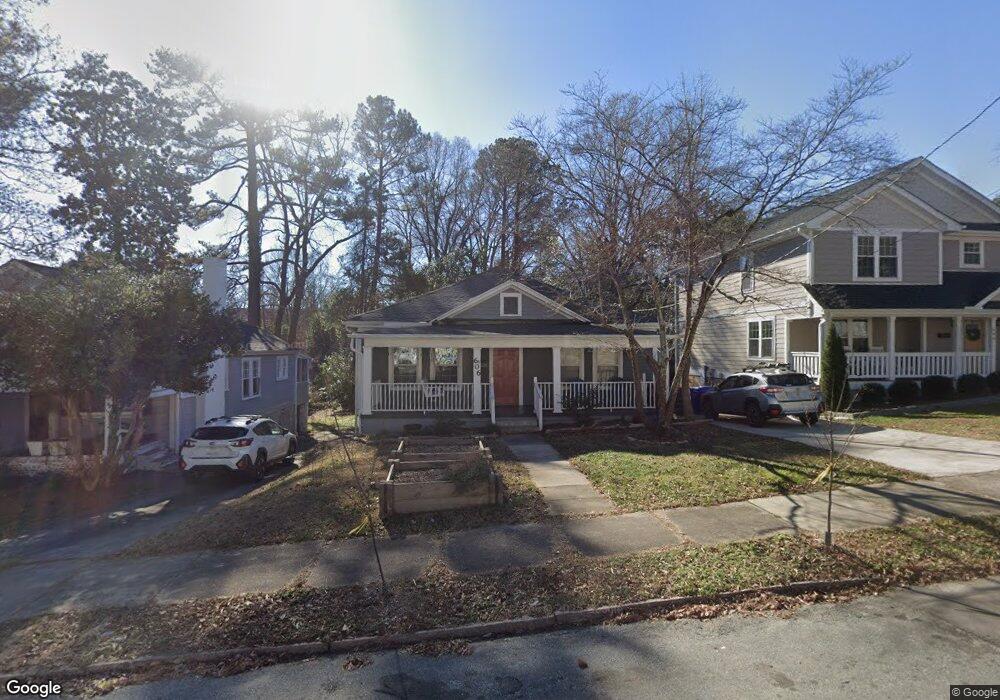
606 Dunbar St Durham, NC 27701
Hayti District NeighborhoodEstimated Value: $397,000 - $440,000
3
Beds
2
Baths
1,617
Sq Ft
$257/Sq Ft
Est. Value
About This Home
This home is located at 606 Dunbar St, Durham, NC 27701 and is currently estimated at $416,170, approximately $257 per square foot. 606 Dunbar St is a home located in Durham County with nearby schools including Canistota Elementary School, Fayetteville Street Elementary School, and James E. Shepard Middle School.
Ownership History
Date
Name
Owned For
Owner Type
Purchase Details
Closed on
Nov 6, 2020
Sold by
Brighter Horizons Llc
Bought by
Lucey Kelly
Current Estimated Value
Home Financials for this Owner
Home Financials are based on the most recent Mortgage that was taken out on this home.
Original Mortgage
$220,000
Outstanding Balance
$196,120
Interest Rate
2.9%
Mortgage Type
New Conventional
Estimated Equity
$220,050
Purchase Details
Closed on
Dec 17, 2018
Sold by
Groton Frederick Don and Bullock Lace
Bought by
Brighter Horizons Llc
Create a Home Valuation Report for This Property
The Home Valuation Report is an in-depth analysis detailing your home's value as well as a comparison with similar homes in the area
Home Values in the Area
Average Home Value in this Area
Purchase History
| Date | Buyer | Sale Price | Title Company |
|---|---|---|---|
| Lucey Kelly | $275,000 | None Available | |
| Brighter Horizons Llc | $75,000 | None Available |
Source: Public Records
Mortgage History
| Date | Status | Borrower | Loan Amount |
|---|---|---|---|
| Open | Lucey Kelly | $220,000 |
Source: Public Records
Tax History Compared to Growth
Tax History
| Year | Tax Paid | Tax Assessment Tax Assessment Total Assessment is a certain percentage of the fair market value that is determined by local assessors to be the total taxable value of land and additions on the property. | Land | Improvement |
|---|---|---|---|---|
| 2025 | $4,826 | $486,857 | $240,581 | $246,276 |
| 2024 | $3,537 | $253,585 | $55,084 | $198,501 |
| 2023 | $3,322 | $253,585 | $55,084 | $198,501 |
| 2022 | $3,246 | $253,585 | $55,084 | $198,501 |
| 2021 | $3,230 | $253,585 | $55,084 | $198,501 |
| 2020 | $873 | $70,166 | $23,440 | $46,726 |
| 2019 | $873 | $70,166 | $23,440 | $46,726 |
| 2018 | $953 | $70,229 | $11,720 | $58,509 |
| 2017 | $946 | $70,229 | $11,720 | $58,509 |
| 2016 | $914 | $70,229 | $11,720 | $58,509 |
| 2015 | $1,278 | $92,294 | $17,138 | $75,156 |
| 2014 | $1,278 | $92,294 | $17,138 | $75,156 |
Source: Public Records
Map
Nearby Homes