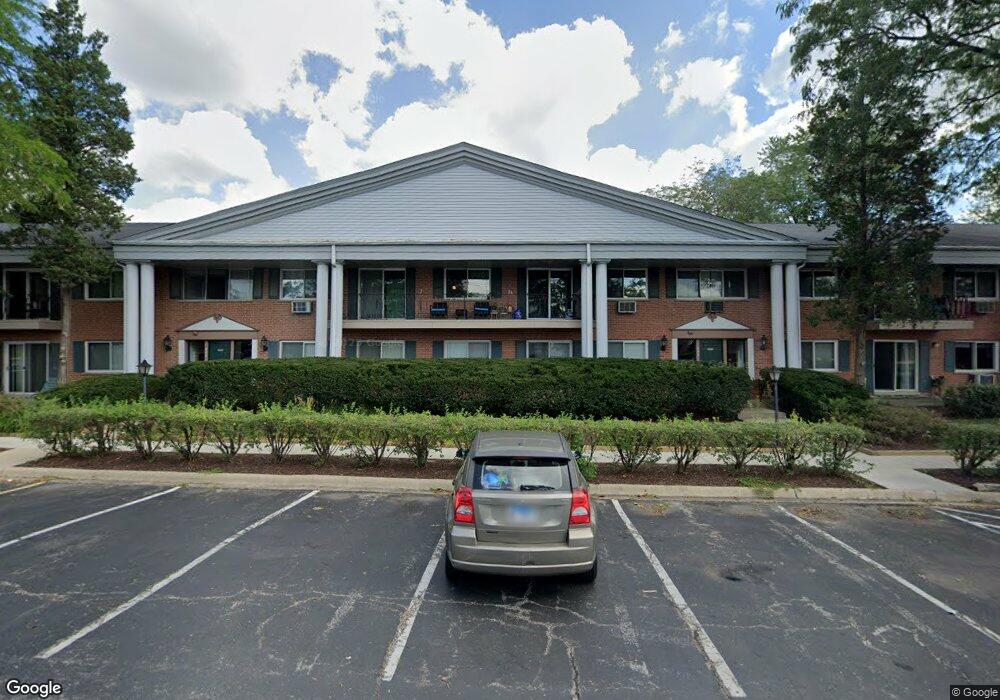
606 E Algonquin Rd Unit I106 Arlington Heights, IL 60005
Estimated Value: $201,000 - $231,849
2
Beds
2
Baths
1,200
Sq Ft
$182/Sq Ft
Est. Value
About This Home
This home is located at 606 E Algonquin Rd Unit I106, Arlington Heights, IL 60005 and is currently estimated at $218,712, approximately $182 per square foot. 606 E Algonquin Rd Unit I106 is a home located in Cook County with nearby schools including Holmes Jr High School, Juliette Low Elementary School, and Rolling Meadows High School.
Ownership History
Date
Name
Owned For
Owner Type
Purchase Details
Closed on
May 2, 2016
Sold by
Jach Bartosz
Bought by
Jach Bartosz
Current Estimated Value
Purchase Details
Closed on
Nov 6, 2012
Sold by
Jach Bartosz and Jach Elizbeita
Bought by
Jach Bartosz
Purchase Details
Closed on
Dec 6, 2007
Sold by
Sullivan Celeste M
Bought by
Jach Bartosz and Jach Elzbieta
Home Financials for this Owner
Home Financials are based on the most recent Mortgage that was taken out on this home.
Original Mortgage
$139,200
Interest Rate
6.3%
Mortgage Type
Purchase Money Mortgage
Purchase Details
Closed on
May 3, 2001
Sold by
Sullivan Celeste M
Bought by
Sullivan Celeste M and Celeste M Sullivan Trust
Purchase Details
Closed on
May 23, 1996
Sold by
Lasalle National Trust Na
Bought by
Sullivan Celeste M
Home Financials for this Owner
Home Financials are based on the most recent Mortgage that was taken out on this home.
Original Mortgage
$116,299
Interest Rate
8%
Create a Home Valuation Report for This Property
The Home Valuation Report is an in-depth analysis detailing your home's value as well as a comparison with similar homes in the area
Home Values in the Area
Average Home Value in this Area
Purchase History
| Date | Buyer | Sale Price | Title Company |
|---|---|---|---|
| Jach Bartosz | -- | None Available | |
| Jach Bartosz | -- | None Available | |
| Jach Bartosz | $174,000 | Republic Title Company | |
| Sullivan Celeste M | -- | -- | |
| Sullivan Celeste M | $116,000 | -- |
Source: Public Records
Mortgage History
| Date | Status | Borrower | Loan Amount |
|---|---|---|---|
| Previous Owner | Jach Bartosz | $139,200 | |
| Previous Owner | Sullivan Celeste M | $116,299 |
Source: Public Records
Tax History Compared to Growth
Tax History
| Year | Tax Paid | Tax Assessment Tax Assessment Total Assessment is a certain percentage of the fair market value that is determined by local assessors to be the total taxable value of land and additions on the property. | Land | Improvement |
|---|---|---|---|---|
| 2024 | $4,307 | $16,650 | $2,714 | $13,936 |
| 2023 | $4,109 | $16,650 | $2,714 | $13,936 |
| 2022 | $4,109 | $16,650 | $2,714 | $13,936 |
| 2021 | $3,860 | $13,657 | $1,780 | $11,877 |
| 2020 | $3,749 | $13,657 | $1,780 | $11,877 |
| 2019 | $3,807 | $15,308 | $1,780 | $13,528 |
| 2018 | $2,170 | $9,578 | $1,526 | $8,052 |
| 2017 | $2,139 | $9,578 | $1,526 | $8,052 |
| 2016 | $2,470 | $9,578 | $1,526 | $8,052 |
| 2015 | $1,421 | $7,748 | $1,356 | $6,392 |
| 2014 | $1,418 | $7,748 | $1,356 | $6,392 |
| 2013 | $1,368 | $7,748 | $1,356 | $6,392 |
Source: Public Records
Map
Nearby Homes
- 2206 S Goebbert Rd Unit 409
- 2234 S Crambourne Way
- 2315 S Goebbert Rd Unit D209
- 2342 S Shag Bark Trail
- 1020 Arbor Ct
- 1016 Arbor Ct
- 1008 Arbor Ct
- 2669 S Embers Ln Unit 142669
- 700 S Noah Terrace
- 1822 W Catalpa Ln
- 1535 S Douglas Ave
- 808 S Deborah Ln
- 1813 W Pheasant Trail
- 1107 E Algonquin Rd Unit 4
- 1111 E Algonquin Rd Unit 1
- 1109 S Lavergne Dr
- 1119 E Algonquin Rd Unit 2
- 1119 E Algonquin Rd Unit 7
- 1115 E Algonquin Rd Unit 8
- 1607 S Kaspar Ave
- 606 E Algonquin Rd Unit I202
- 606 E Algonquin Rd Unit I105
- 606 E Algonquin Rd Unit I205
- 606 E Algonquin Rd Unit I104
- 606 E Algonquin Rd Unit I101
- 606 E Algonquin Rd Unit I103
- 606 E Algonquin Rd Unit I102
- 606 E Algonquin Rd Unit I206
- 606 E Algonquin Rd Unit I204
- 606 E Algonquin Rd Unit I203
- 606 E Algonquin Rd Unit I201
- 606 E Algonquin Rd Unit 201
- 2121 S Arlington Heights Rd
- 22 W Algonquin Rd
- 2120 S Arlington Heights Rd
- 111 E Algonquin Rd
- 2101 S Arlington Heights Rd Unit 135
- 2101 S Arlington Heights Rd
- 2222 S Goebbert Rd Unit 351
- 2222 S Goebbert Rd Unit 158