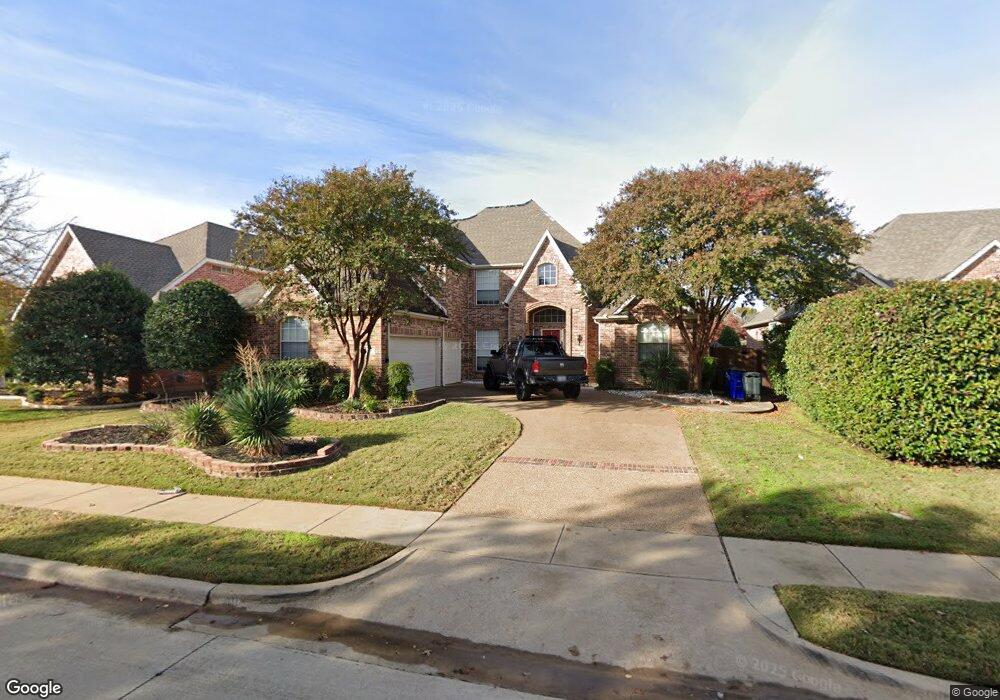
606 Eagle Trail Keller, TX 76248
Hidden Lakes NeighborhoodEstimated Value: $697,000 - $727,000
4
Beds
3
Baths
3,447
Sq Ft
$207/Sq Ft
Est. Value
About This Home
This home is located at 606 Eagle Trail, Keller, TX 76248 and is currently estimated at $713,449, approximately $206 per square foot. 606 Eagle Trail is a home located in Tarrant County with nearby schools including Hidden Lakes Elementary School, Bear Creek Intermediate School, and Keller Middle School.
Ownership History
Date
Name
Owned For
Owner Type
Purchase Details
Closed on
Mar 14, 2023
Sold by
Pullarkat Renil Radhakrishnan
Bought by
Pullarkat Family Trust
Current Estimated Value
Purchase Details
Closed on
Aug 17, 2001
Sold by
Creek David D and Creek Margaret A
Bought by
Radhakrishnan Bindu and Radhakrishnan Renil
Home Financials for this Owner
Home Financials are based on the most recent Mortgage that was taken out on this home.
Original Mortgage
$256,000
Interest Rate
8.33%
Purchase Details
Closed on
Feb 26, 1999
Sold by
Sanders Custom Builder Ltd
Bought by
Creek David D and Creek Margaret A
Home Financials for this Owner
Home Financials are based on the most recent Mortgage that was taken out on this home.
Original Mortgage
$289,500
Interest Rate
6.75%
Purchase Details
Closed on
Aug 17, 1998
Sold by
Lumbermens Investment Corp
Bought by
Sanders Custom Builder Ltd
Create a Home Valuation Report for This Property
The Home Valuation Report is an in-depth analysis detailing your home's value as well as a comparison with similar homes in the area
Home Values in the Area
Average Home Value in this Area
Purchase History
| Date | Buyer | Sale Price | Title Company |
|---|---|---|---|
| Pullarkat Family Trust | -- | -- | |
| Radhakrishnan Bindu | -- | Chicago Title Insurance Co | |
| Creek David D | -- | American Title Co | |
| Sanders Custom Builder Ltd | -- | American Title |
Source: Public Records
Mortgage History
| Date | Status | Borrower | Loan Amount |
|---|---|---|---|
| Previous Owner | Radhakrishnan Bindu | $256,000 | |
| Previous Owner | Creek David D | $289,500 | |
| Closed | Radhakrishnan Bindu | $48,000 |
Source: Public Records
Tax History
| Year | Tax Paid | Tax Assessment Tax Assessment Total Assessment is a certain percentage of the fair market value that is determined by local assessors to be the total taxable value of land and additions on the property. | Land | Improvement |
|---|---|---|---|---|
| 2025 | $10,129 | $650,000 | $85,382 | $564,618 |
| 2024 | $10,129 | $650,000 | $85,382 | $564,618 |
| 2023 | $11,290 | $728,505 | $85,382 | $643,123 |
| 2022 | $11,912 | $540,000 | $85,382 | $454,618 |
| 2021 | $12,793 | $539,910 | $115,000 | $424,910 |
| 2020 | $11,720 | $489,000 | $115,000 | $374,000 |
| 2019 | $12,312 | $489,000 | $112,627 | $376,373 |
| 2018 | $11,024 | $460,393 | $115,000 | $345,393 |
| 2017 | $10,784 | $476,709 | $115,000 | $361,709 |
| 2016 | $9,804 | $453,178 | $80,000 | $373,178 |
| 2015 | $8,805 | $345,900 | $42,000 | $303,900 |
| 2014 | $8,805 | $345,900 | $42,000 | $303,900 |
Source: Public Records
Map
Nearby Homes
- 606 Eagle Ct
- 2722 Wildcreek Trail
- 801 Glenmont Rd
- 807 Veiled Ct
- 2311 Watercrest Dr
- 920 Nottingham Rd
- 925 Saint George Ct
- 829 Siena Dr
- 2499 Union Church Rd
- 2304 Watercrest Dr
- 715 Misty Ct
- 2401 Lower Brook Ct
- 2616 Park Grove Loop
- 2213 Graystone Ct
- 3325 Creek Rd
- 387 Watermere Dr
- 807 Stillwater Ct
- 2636 Park Grove Loop
- 945 Deer Hollow Blvd
- 332 Watermere Dr
- 608 Eagle Trail
- 604 Eagle Trail
- 607 Eagle Ct
- 602 Eagle Trail
- 609 Eagle Ct
- 605 Eagle Ct
- 607 Eagle Trail
- 605 Eagle Trail
- 603 Eagle Ct
- 609 Eagle Trail
- 600 Eagle Trail
- 624 Edgebrook Ave
- 622 Edgebrook Ave
- 701 Eagle Trail
- 601 Eagle Ct
- 601 Eagle Trail
- 703 Eagle Trail
- 608 Eagle Ct
- 604 Eagle Ct
- 618 Edgebrook Ave
Your Personal Tour Guide
Ask me questions while you tour the home.