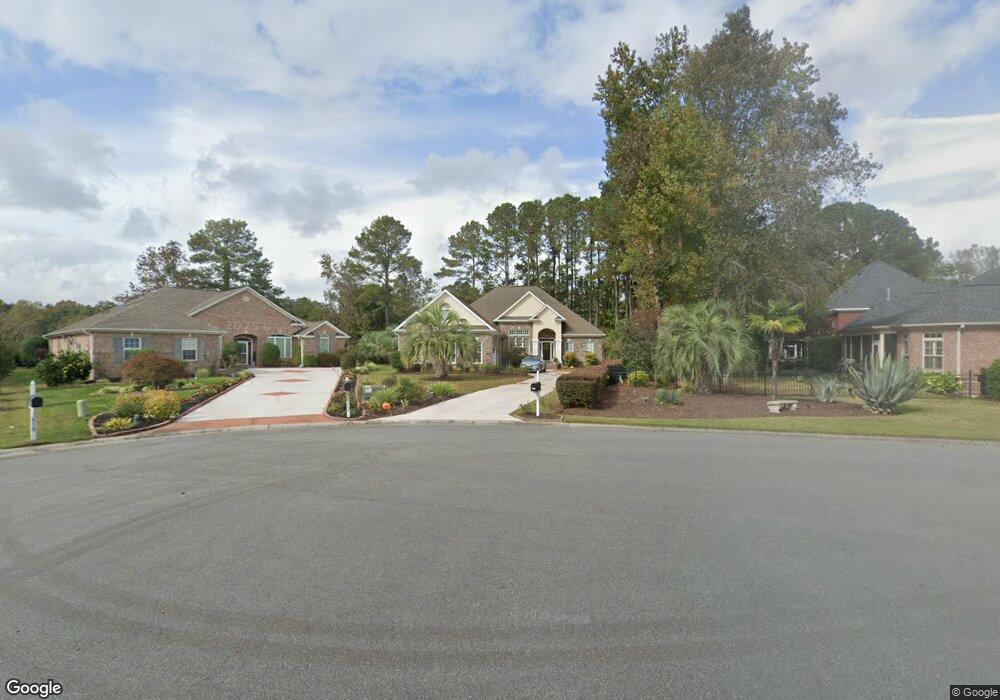
606 Ivey Ridge Ct Unit Blackmoor Murrells Inlet, SC 29576
Burgess NeighborhoodEstimated Value: $610,032 - $662,000
4
Beds
3
Baths
3,571
Sq Ft
$179/Sq Ft
Est. Value
About This Home
This home is located at 606 Ivey Ridge Ct Unit Blackmoor, Murrells Inlet, SC 29576 and is currently estimated at $640,008, approximately $179 per square foot. 606 Ivey Ridge Ct Unit Blackmoor is a home located in Horry County with nearby schools including St. James Elementary School, St. James Middle School, and St. James Intermediate.
Ownership History
Date
Name
Owned For
Owner Type
Purchase Details
Closed on
Oct 19, 2018
Sold by
Willis James Lee
Bought by
Schroeder Thomas and Joan
Current Estimated Value
Home Financials for this Owner
Home Financials are based on the most recent Mortgage that was taken out on this home.
Original Mortgage
$370,540
Outstanding Balance
$323,821
Interest Rate
4.6%
Mortgage Type
New Conventional
Estimated Equity
$316,187
Purchase Details
Closed on
Jan 21, 2014
Sold by
Shytles Douglas M and The Shirley B Shytles Marital
Bought by
Willis James Lee and Willis Linda B
Purchase Details
Closed on
Jan 21, 2009
Sold by
Jamison Builders Inc
Bought by
Shytles Douglas M
Purchase Details
Closed on
Jul 14, 2005
Sold by
Sipe Dennis L and Sipe Susan A
Bought by
Jamison Builders Inc
Purchase Details
Closed on
Mar 13, 2001
Sold by
Blackmoor Land Development Company Inc
Bought by
Sipe Dennis L and Sipe Susan A
Create a Home Valuation Report for This Property
The Home Valuation Report is an in-depth analysis detailing your home's value as well as a comparison with similar homes in the area
Home Values in the Area
Average Home Value in this Area
Purchase History
| Date | Buyer | Sale Price | Title Company |
|---|---|---|---|
| Schroeder Thomas | $382,000 | -- | |
| Willis James Lee | $340,000 | -- | |
| Shytles Douglas M | $371,000 | -- | |
| Jamison Builders Inc | $79,000 | -- | |
| Sipe Dennis L | $57,400 | -- |
Source: Public Records
Mortgage History
| Date | Status | Borrower | Loan Amount |
|---|---|---|---|
| Open | Schroeder Thomas | $370,540 |
Source: Public Records
Tax History Compared to Growth
Tax History
| Year | Tax Paid | Tax Assessment Tax Assessment Total Assessment is a certain percentage of the fair market value that is determined by local assessors to be the total taxable value of land and additions on the property. | Land | Improvement |
|---|---|---|---|---|
| 2024 | $1,817 | $24,037 | $6,595 | $17,442 |
| 2023 | $1,817 | $15,295 | $3,031 | $12,264 |
| 2021 | $1,404 | $15,295 | $3,031 | $12,264 |
| 2020 | $1,275 | $15,295 | $3,031 | $12,264 |
| 2019 | $4,598 | $15,295 | $3,031 | $12,264 |
| 2018 | $1,182 | $13,799 | $2,803 | $10,996 |
| 2017 | $1,167 | $13,799 | $2,803 | $10,996 |
| 2016 | -- | $13,799 | $2,803 | $10,996 |
| 2015 | $4,432 | $13,799 | $2,803 | $10,996 |
| 2014 | $1,167 | $13,799 | $2,803 | $10,996 |
Source: Public Records
Map
Nearby Homes
- 6200 Longwood Dr
- 6449 Somersby Dr
- 6705 Oakmere Ct
- 6443 Longwood Dr
- 6439 Longwood Dr
- 6578 Wellington Dr
- 448 Mahogany Dr Unit 201
- 6548 Wellington Dr
- 332 Black Oak Ln Unit 102
- 314 Black Oak Ln Unit 102
- 319 Black Oak Ln Unit 101
- 5858 Longwood Dr Unit 201
- 6522 Devonshire Ln
- 501 Aft Ct Unit 101
- 5852 Longwood Dr Unit 302
- 1845 Groveway Ct
- 237 Moonglow Cir Unit 102
- 806 Sail Ln Unit 202
- 822 Sail Ln Unit 202
- 5792 Longwood Dr Unit 302
- 606 Ivey Ridge Ct
- 612 Ivey Ridge Ct
- 167 Waterhall Dr
- 163 Waterhall Dr Unit Blackmoor
- 163 Waterhall Dr
- 175 Waterhall Dr
- 175 Waterhall Dr Unit H-6
- 618 Ivey Ridge Ct
- Lot 224 Ivey Ridge Ct
- 151 Waterhall Dr
- 151 Waterhall Dr Unit Waterhall at Blackmo
- 210 Waterhall Dr
- 211 Waterhall Dr
- 212 Waterhall Dr
- 212 Waterhall Dr Unit Waterhall at Blackmo
- 213 Waterhall Dr
- 601 Ivey Ridge Ct
- 613 Ivey Ridge Ct
- 607 Ivey Ridge Ct
- 168 Waterhall Dr