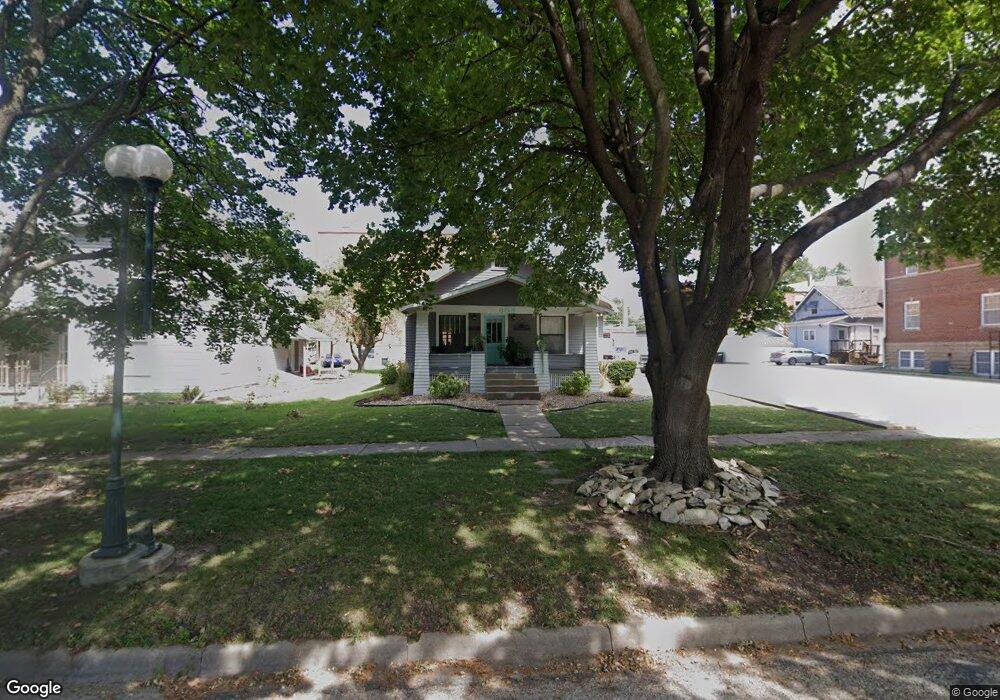
606 Kickapoo St Hiawatha, KS 66434
Estimated Value: $107,000 - $167,000
3
Beds
3
Baths
1,670
Sq Ft
$82/Sq Ft
Est. Value
About This Home
This home is located at 606 Kickapoo St, Hiawatha, KS 66434 and is currently estimated at $137,441, approximately $82 per square foot. 606 Kickapoo St is a home located in Brown County with nearby schools including Hiawatha Elementary School, Hiawatha Middle School, and Hiawatha Senior High School.
Ownership History
Date
Name
Owned For
Owner Type
Purchase Details
Closed on
Jun 21, 2018
Sold by
Federal Home Loan Mortgage Corporation
Bought by
Unruh Benjamin C
Current Estimated Value
Home Financials for this Owner
Home Financials are based on the most recent Mortgage that was taken out on this home.
Original Mortgage
$24,000
Interest Rate
4.5%
Mortgage Type
New Conventional
Purchase Details
Closed on
Nov 22, 2017
Sold by
Brown County Sheriff
Bought by
Gnb Mortgage Co Inc
Create a Home Valuation Report for This Property
The Home Valuation Report is an in-depth analysis detailing your home's value as well as a comparison with similar homes in the area
Home Values in the Area
Average Home Value in this Area
Purchase History
| Date | Buyer | Sale Price | Title Company |
|---|---|---|---|
| Unruh Benjamin C | -- | None Available | |
| Gnb Mortgage Co Inc | $56,118 | -- |
Source: Public Records
Mortgage History
| Date | Status | Borrower | Loan Amount |
|---|---|---|---|
| Previous Owner | Unruh Benjamin C | $24,000 |
Source: Public Records
Tax History
| Year | Tax Paid | Tax Assessment Tax Assessment Total Assessment is a certain percentage of the fair market value that is determined by local assessors to be the total taxable value of land and additions on the property. | Land | Improvement |
|---|---|---|---|---|
| 2025 | $1,274 | $11,891 | $1,055 | $10,836 |
| 2024 | $16 | $14,383 | $833 | $13,550 |
| 2023 | $962 | $8,235 | $684 | $7,551 |
| 2022 | $841 | $7,487 | $611 | $6,876 |
| 2021 | $539 | $4,481 | $607 | $3,874 |
| 2020 | $521 | $4,394 | $607 | $3,787 |
| 2019 | $555 | $4,394 | $539 | $3,855 |
| 2018 | $1,334 | $9,522 | $539 | $8,983 |
| 2017 | $1,334 | $9,602 | $539 | $9,063 |
| 2016 | $1,344 | $9,626 | $473 | $9,153 |
| 2015 | -- | $9,146 | $473 | $8,673 |
| 2014 | -- | $9,146 | $466 | $8,680 |
Source: Public Records
Map
Nearby Homes
- 710 Pottawatomie St
- 505 Pottawatomie St
- 401 Kickapoo St
- 505 Shawnee St
- 715 Shawnee St
- 506 Shawnee St
- 815 Shawnee St
- 313 Shawnee St
- 214 Oregon St
- 500 Miami St
- 402 Minnetare Ln
- 110 Osage Ave
- 206 Hiawatha Ave
- 109 Sioux Ave
- 1111 Miami St
- 209 Cherokee Ave
- 411 Navajo Ave
- 111 Pawnee St
- 1368 240th St
- 1206 Wentley Dr
Your Personal Tour Guide
Ask me questions while you tour the home.