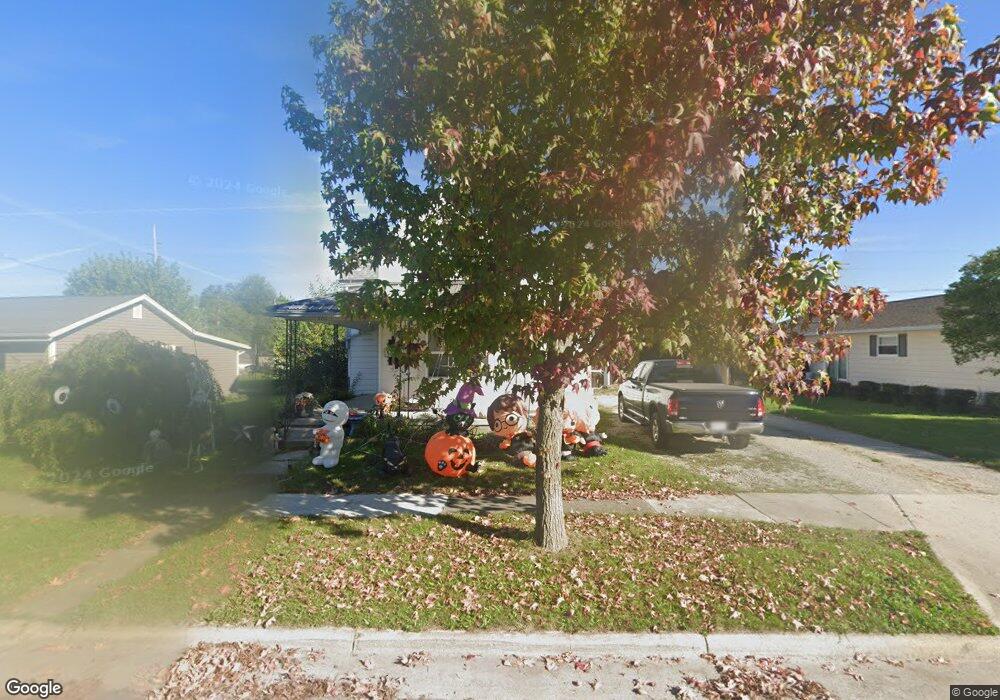
606 Lima St Wapakoneta, OH 45895
Estimated Value: $121,000 - $136,000
3
Beds
2
Baths
1,222
Sq Ft
$104/Sq Ft
Est. Value
About This Home
This home is located at 606 Lima St, Wapakoneta, OH 45895 and is currently estimated at $127,291, approximately $104 per square foot. 606 Lima St is a home located in Auglaize County with nearby schools including Wapakoneta Elementary School, Wapakoneta High School, and Wapakoneta Middle School.
Ownership History
Date
Name
Owned For
Owner Type
Purchase Details
Closed on
Feb 20, 2008
Sold by
Lemmon Budd and Lemmon Treena
Bought by
Long Lesley V M
Current Estimated Value
Home Financials for this Owner
Home Financials are based on the most recent Mortgage that was taken out on this home.
Original Mortgage
$57,103
Outstanding Balance
$35,716
Interest Rate
5.9%
Mortgage Type
FHA
Estimated Equity
$91,575
Purchase Details
Closed on
Jun 21, 2002
Sold by
Rayburn Clifford R
Bought by
Lemmon Budd and Lemmon Treena
Purchase Details
Closed on
Jul 25, 1997
Sold by
Rayburn Dorothy L
Bought by
Rayburn Clifford R
Create a Home Valuation Report for This Property
The Home Valuation Report is an in-depth analysis detailing your home's value as well as a comparison with similar homes in the area
Home Values in the Area
Average Home Value in this Area
Purchase History
| Date | Buyer | Sale Price | Title Company |
|---|---|---|---|
| Long Lesley V M | $58,000 | Attorney | |
| Lemmon Budd | $66,900 | -- | |
| Rayburn Clifford R | $59,000 | -- |
Source: Public Records
Mortgage History
| Date | Status | Borrower | Loan Amount |
|---|---|---|---|
| Open | Long Lesley V M | $57,103 |
Source: Public Records
Tax History Compared to Growth
Tax History
| Year | Tax Paid | Tax Assessment Tax Assessment Total Assessment is a certain percentage of the fair market value that is determined by local assessors to be the total taxable value of land and additions on the property. | Land | Improvement |
|---|---|---|---|---|
| 2024 | $1,503 | $30,830 | $8,160 | $22,670 |
| 2023 | $1,016 | $30,830 | $8,160 | $22,670 |
| 2022 | $848 | $23,480 | $7,480 | $16,000 |
| 2021 | $829 | $23,480 | $7,480 | $16,000 |
| 2020 | $831 | $23,482 | $7,480 | $16,002 |
| 2019 | $713 | $19,313 | $6,153 | $13,160 |
| 2018 | $704 | $18,998 | $6,153 | $12,845 |
| 2017 | $701 | $18,998 | $6,153 | $12,845 |
| 2016 | $673 | $18,284 | $5,768 | $12,516 |
| 2015 | $679 | $18,284 | $5,768 | $12,516 |
| 2014 | $686 | $18,284 | $5,768 | $12,516 |
| 2013 | $698 | $18,284 | $5,768 | $12,516 |
Source: Public Records
Map
Nearby Homes
- 0 Ohio 67
- 409 S Pine St
- 201 E Pearl St
- 9 E Silver St
- 307 W Auglaize St
- 420 Hoopengarner St
- 0 Wapakoneta Cridersville Rd
- 608 W Benton St
- 322 Cole Dr
- 102 Wapak St
- 814 W Benton St
- 808 Aster Dr
- 106 Valleyview Dr
- 920 Primrose Dr
- 1100 W Auglaize St
- 1028 Stonegate Ct
- 601 Warren St
- 1020 Timber Trail
- 17092 Hauss Rd