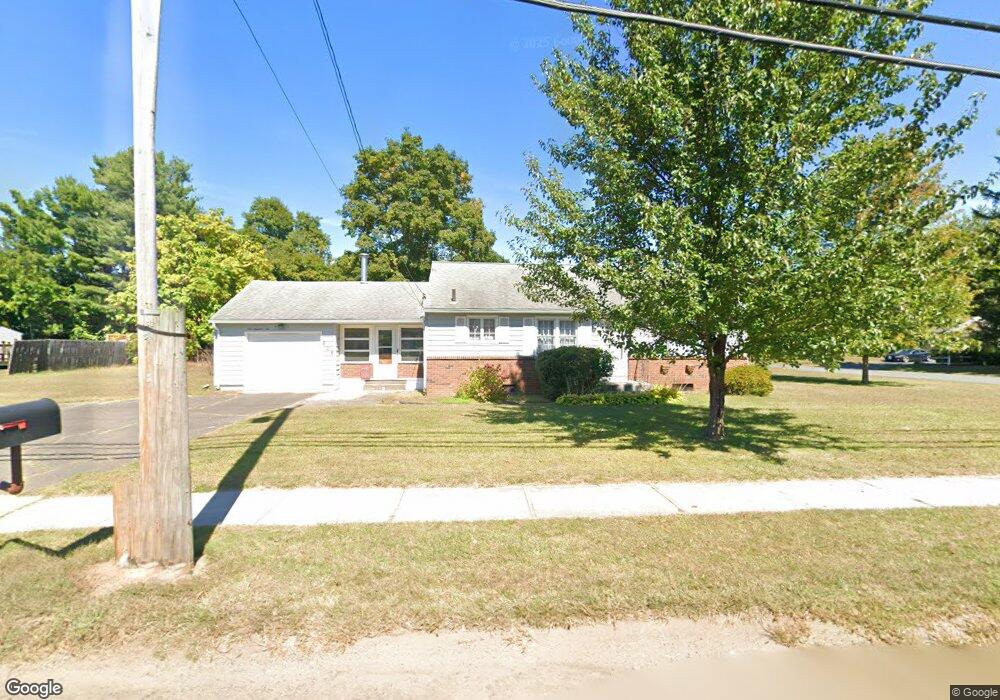
606 Morgan Rd West Springfield, MA 01089
Estimated Value: $316,000 - $348,000
3
Beds
1
Bath
1,064
Sq Ft
$310/Sq Ft
Est. Value
About This Home
This home is located at 606 Morgan Rd, West Springfield, MA 01089 and is currently estimated at $330,215, approximately $310 per square foot. 606 Morgan Rd is a home located in Hampden County with nearby schools including Hampden Charter School of Science West and St Thomas The Apostle School.
Ownership History
Date
Name
Owned For
Owner Type
Purchase Details
Closed on
Apr 2, 2013
Sold by
Motherway Francis R
Bought by
Motherway Donna A
Current Estimated Value
Home Financials for this Owner
Home Financials are based on the most recent Mortgage that was taken out on this home.
Original Mortgage
$94,400
Outstanding Balance
$66,283
Interest Rate
3.43%
Mortgage Type
New Conventional
Estimated Equity
$263,932
Purchase Details
Closed on
Mar 5, 2013
Sold by
Longtin Francis J
Bought by
Motherway Francis R
Home Financials for this Owner
Home Financials are based on the most recent Mortgage that was taken out on this home.
Original Mortgage
$94,400
Outstanding Balance
$66,283
Interest Rate
3.43%
Mortgage Type
New Conventional
Estimated Equity
$263,932
Create a Home Valuation Report for This Property
The Home Valuation Report is an in-depth analysis detailing your home's value as well as a comparison with similar homes in the area
Home Values in the Area
Average Home Value in this Area
Purchase History
| Date | Buyer | Sale Price | Title Company |
|---|---|---|---|
| Motherway Donna A | -- | -- | |
| Motherway Francis R | $118,000 | -- | |
| Motherway Francis R | $118,000 | -- |
Source: Public Records
Mortgage History
| Date | Status | Borrower | Loan Amount |
|---|---|---|---|
| Open | Motherway Francis R | $94,400 | |
| Closed | Motherway Francis R | $94,400 |
Source: Public Records
Tax History Compared to Growth
Tax History
| Year | Tax Paid | Tax Assessment Tax Assessment Total Assessment is a certain percentage of the fair market value that is determined by local assessors to be the total taxable value of land and additions on the property. | Land | Improvement |
|---|---|---|---|---|
| 2025 | $3,856 | $259,300 | $117,000 | $142,300 |
| 2024 | $3,808 | $257,100 | $117,000 | $140,100 |
| 2023 | $3,660 | $235,500 | $117,000 | $118,500 |
| 2022 | $3,308 | $209,900 | $106,200 | $103,700 |
| 2021 | $3,025 | $179,000 | $85,100 | $93,900 |
| 2020 | $3,031 | $178,400 | $85,100 | $93,300 |
| 2019 | $3,026 | $178,400 | $85,100 | $93,300 |
| 2018 | $3,042 | $178,400 | $85,100 | $93,300 |
| 2017 | $3,042 | $178,400 | $85,100 | $93,300 |
| 2016 | $2,989 | $175,900 | $80,000 | $95,900 |
| 2015 | $2,931 | $172,500 | $78,500 | $94,000 |
| 2014 | $711 | $172,500 | $78,500 | $94,000 |
Source: Public Records
Map
Nearby Homes
- 42 Gregory Ln
- 86 Birnie Ave
- 64 Apple Ridge Rd
- 36 Shady Brook
- 43 Wishing Well Way
- 32 Windpath E
- 81 Laurence Dr
- 34 High Meadow Dr
- 283 Forest Glen
- 147 Grandview Ave
- 31 Stone Path Ln
- 61 Clarence St
- 1304 Elm St Unit 4C
- 80 Brush Hill Ave Unit 28
- 80 Brush Hill Ave Unit 32
- 11 Annie's Way
- 65 Verdugo St
- 142 Morton St
- 19 Cora St
- 59 Clayton Dr