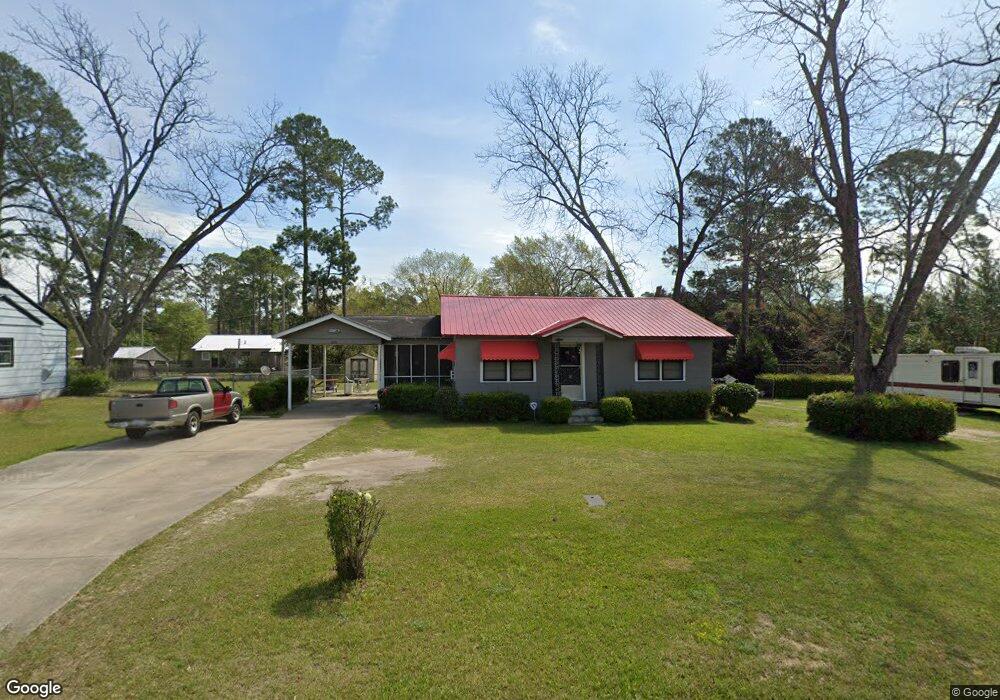
606 N 1st St Cordele, GA 31015
Estimated Value: $68,000 - $81,000
2
Beds
1
Bath
960
Sq Ft
$80/Sq Ft
Est. Value
About This Home
This home is located at 606 N 1st St, Cordele, GA 31015 and is currently estimated at $76,860, approximately $80 per square foot. 606 N 1st St is a home located in Crisp County with nearby schools including Crisp County Elementary School, Crisp County Primary School, and Crisp County Middle School.
Ownership History
Date
Name
Owned For
Owner Type
Purchase Details
Closed on
Sep 30, 2016
Sold by
Wilkerson Alissa
Bought by
Quarterman Ada
Current Estimated Value
Home Financials for this Owner
Home Financials are based on the most recent Mortgage that was taken out on this home.
Original Mortgage
$31,420
Outstanding Balance
$25,115
Interest Rate
3.62%
Mortgage Type
FHA
Estimated Equity
$51,745
Purchase Details
Closed on
Jan 10, 2014
Sold by
Waldrip Reba Braswell
Bought by
Wilkerson Eric and Wilkerson Alissa
Home Financials for this Owner
Home Financials are based on the most recent Mortgage that was taken out on this home.
Original Mortgage
$25,166
Interest Rate
4.44%
Mortgage Type
New Conventional
Purchase Details
Closed on
Mar 20, 2013
Sold by
Sponseller Sherrie Gunter
Bought by
Mcdowell Kathy M
Purchase Details
Closed on
Sep 19, 2002
Sold by
Waldrip Reba B
Bought by
Waldrip Reba Braswell Etal
Purchase Details
Closed on
Jul 19, 1994
Bought by
Waldrip Reba B
Purchase Details
Closed on
Mar 29, 1973
Bought by
Waldrip James W
Create a Home Valuation Report for This Property
The Home Valuation Report is an in-depth analysis detailing your home's value as well as a comparison with similar homes in the area
Home Values in the Area
Average Home Value in this Area
Purchase History
| Date | Buyer | Sale Price | Title Company |
|---|---|---|---|
| Quarterman Ada | $32,000 | -- | |
| Wilkerson Eric | $24,000 | -- | |
| Mcdowell Kathy M | -- | -- | |
| Saunders Charlotte N | -- | -- | |
| Waldrip Reba Braswell Etal | -- | -- | |
| Waldrip Reba B | -- | -- | |
| Waldrip James W | -- | -- |
Source: Public Records
Mortgage History
| Date | Status | Borrower | Loan Amount |
|---|---|---|---|
| Open | Quarterman Ada | $31,420 | |
| Previous Owner | Wilkerson Eric | $25,166 |
Source: Public Records
Tax History Compared to Growth
Tax History
| Year | Tax Paid | Tax Assessment Tax Assessment Total Assessment is a certain percentage of the fair market value that is determined by local assessors to be the total taxable value of land and additions on the property. | Land | Improvement |
|---|---|---|---|---|
| 2025 | $760 | $24,274 | $4,696 | $19,578 |
| 2024 | $760 | $22,589 | $4,696 | $17,893 |
| 2023 | $674 | $19,398 | $2,348 | $17,050 |
| 2022 | $438 | $18,556 | $2,348 | $16,208 |
| 2021 | $429 | $17,713 | $2,348 | $15,365 |
| 2020 | $442 | $17,713 | $2,348 | $15,365 |
| 2019 | $446 | $17,713 | $2,348 | $15,365 |
| 2018 | $307 | $12,413 | $3,522 | $8,891 |
| 2017 | $504 | $12,413 | $3,522 | $8,891 |
| 2016 | $367 | $12,413 | $3,522 | $8,891 |
| 2015 | -- | $12,413 | $3,522 | $8,891 |
| 2014 | -- | $12,413 | $3,522 | $8,891 |
| 2013 | -- | $12,412 | $3,521 | $8,891 |
Source: Public Records
Map
Nearby Homes
- 608 N 1st St
- 605 N Juniper St
- 603 N Juniper St
- 607 N Juniper St
- 610 N 1st St
- 602 N 1st St
- 609 N Juniper St
- 601 N Juniper St
- 612 N 1st St
- 611 N Juniper St
- 606 N Juniper St
- 608 N Juniper St
- 614 N 1st St
- 614 N 1st St
- 610 N Juniper St
- 613 N Juniper St
- 612 N Juniper St
- 616 N 1st St
- 615 N Juniper St
- 620 E 6th Ave