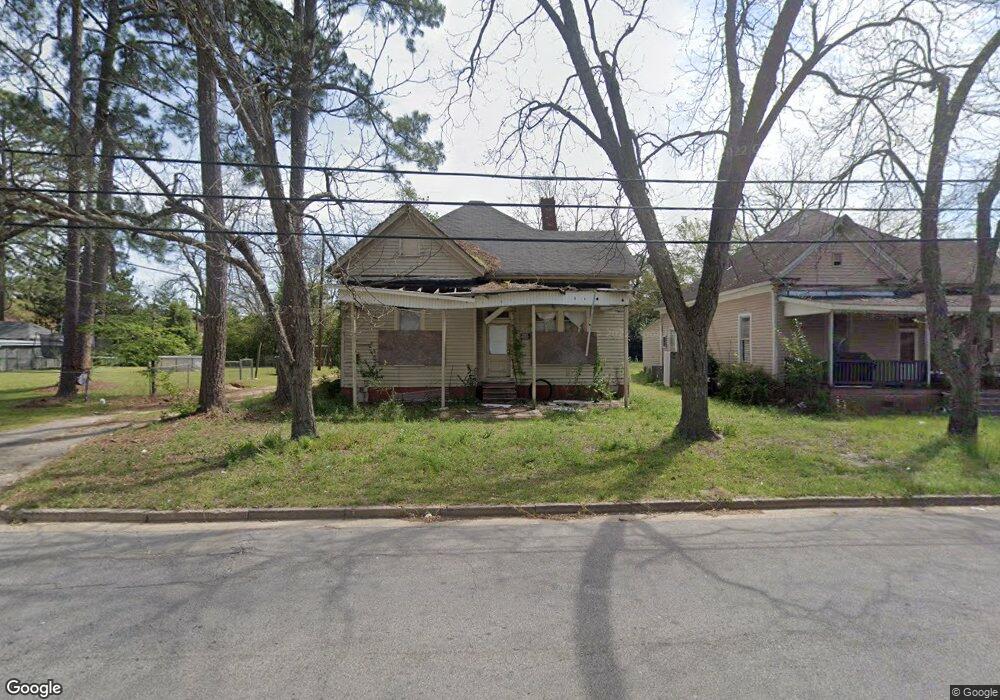
606 N 3rd St Cordele, GA 31015
Estimated Value: $46,000 - $85,000
3
Beds
2
Baths
1,656
Sq Ft
$37/Sq Ft
Est. Value
About This Home
This home is located at 606 N 3rd St, Cordele, GA 31015 and is currently estimated at $61,295, approximately $37 per square foot. 606 N 3rd St is a home located in Crisp County with nearby schools including Crisp County Elementary School, Crisp County Primary School, and Crisp County Middle School.
Ownership History
Date
Name
Owned For
Owner Type
Purchase Details
Closed on
Sep 24, 2010
Sold by
K R Peanut Llc
Bought by
Adkins Joanne and Shorter Johnny
Current Estimated Value
Purchase Details
Closed on
Jun 30, 2010
Sold by
Ameris Bank As Successor By Merger
Bought by
Kr Peanut Llc
Purchase Details
Closed on
Nov 3, 2009
Sold by
Handyman Properties Llc
Bought by
Ameris Bank
Purchase Details
Closed on
Nov 9, 2005
Sold by
Walker Emmett G
Bought by
Handyman Properties Llc
Home Financials for this Owner
Home Financials are based on the most recent Mortgage that was taken out on this home.
Original Mortgage
$416,290
Interest Rate
6%
Mortgage Type
New Conventional
Purchase Details
Closed on
Jan 20, 2000
Sold by
Walker Rosalin R
Bought by
Walker Emmett G
Purchase Details
Closed on
Oct 30, 1992
Sold by
Weldon I B
Bought by
Walker Emmett
Purchase Details
Closed on
Apr 4, 1968
Bought by
Weldon I B
Create a Home Valuation Report for This Property
The Home Valuation Report is an in-depth analysis detailing your home's value as well as a comparison with similar homes in the area
Purchase History
| Date | Buyer | Sale Price | Title Company |
|---|---|---|---|
| Adkins Joanne | $15,000 | -- | |
| Kr Peanut Llc | $7,700 | -- | |
| Ameris Bank | -- | -- | |
| Handyman Properties Llc | $24,300 | -- | |
| Walker Emmett G | -- | -- | |
| Walker Emmett | $90,000 | -- | |
| Weldon I B | -- | -- |
Source: Public Records
Mortgage History
| Date | Status | Borrower | Loan Amount |
|---|---|---|---|
| Previous Owner | Handyman Properties Llc | $416,290 |
Source: Public Records
Tax History
| Year | Tax Paid | Tax Assessment Tax Assessment Total Assessment is a certain percentage of the fair market value that is determined by local assessors to be the total taxable value of land and additions on the property. | Land | Improvement |
|---|---|---|---|---|
| 2025 | $317 | $8,979 | $833 | $8,146 |
| 2024 | $294 | $8,200 | $833 | $7,367 |
| 2023 | $293 | $7,810 | $833 | $6,977 |
| 2022 | $196 | $7,421 | $833 | $6,588 |
| 2021 | $192 | $7,031 | $833 | $6,198 |
| 2020 | $198 | $7,031 | $833 | $6,198 |
| 2019 | $199 | $7,031 | $833 | $6,198 |
| 2018 | $261 | $8,853 | $1,000 | $7,853 |
| 2017 | $359 | $8,853 | $1,000 | $7,853 |
| 2016 | $262 | $8,853 | $1,000 | $7,853 |
| 2015 | -- | $8,853 | $1,000 | $7,853 |
| 2014 | -- | $8,853 | $1,000 | $7,853 |
| 2013 | -- | $8,852 | $1,000 | $7,852 |
Source: Public Records
Map
Nearby Homes
Your Personal Tour Guide
Ask me questions while you tour the home.