


606 N Maple St Durham, NC 27703
East Durham NeighborhoodEstimated payment $2,297/month
Highlights
- The property is located in a historic district
- Open Floorplan
- Deck
- City Lights View
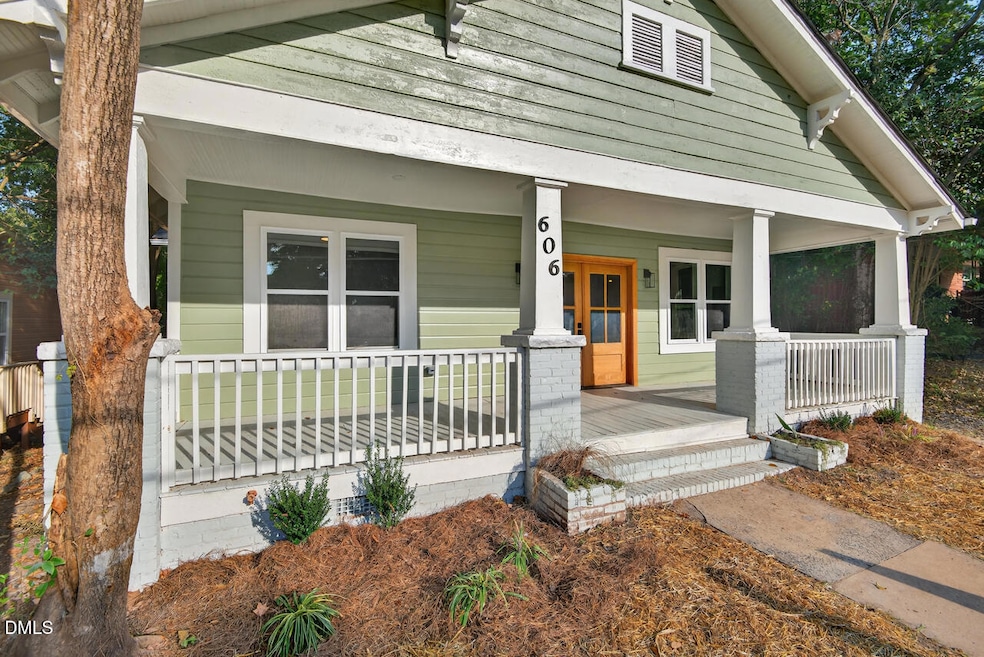
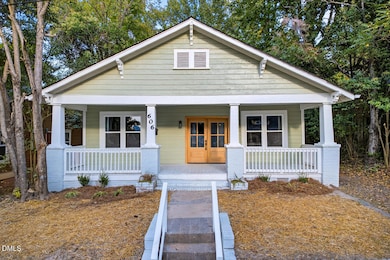
- Craftsman Architecture
- Property is near public transit
About This Home
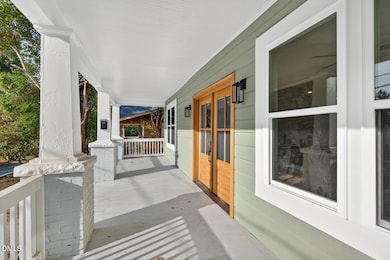
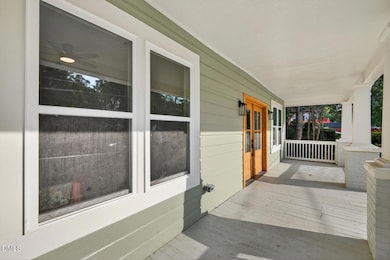
Come Home for the Holidays! On one level in Old East Durham- old & new in perfect harmony. The 1920 Craftsman Cottage has been transformed into a 21st Century 4 Bedroom, 2 Bathroom, 1,761 sq ft. gem! Incredible light & curb appeal. Qualifies for lower interest rate & 3% Down option via Unique Advantage Community Lending Program. OLD: Covered, picketed front porch- with mossy teal paint & creamy white trim finish- on the original German-board pine siding with front a& back & gable brackets. NEW: Wood & glass front French doors, Double-glazed divided light windows, luxury vinyl plank floors, The front door opens into the bright Living Room & Kitchen. The Kitchen has Quartz countertops & center Island, shaker cabinets, an electric cook top stove/oven. The 2 bathrooms have quartz vanities. The front bedrooms open to the shared bathroom & onto the open living space. The convenient, separate laundry room has a utility sink. The 2 bedrooms at rear are larger, including the large, private Master Suite. It has great soft afternoon light, a snappy bathroom with walk in shower and a large walk-in closet. New Utilities: Electrical: box & wiring, most Plumbing, 3-ton HVAC unit + ducts, 8' 9'' ceiling heights. 12' X 16' new rear deck off center hall & directly from the Master Suite. Fold-down attic stairwell with partial flooring. Architectural shingle roof. One car driveway & street parking. 50' X 100' lot - low exterior maintenance. Quiet side-street with access quick access to Downtown Durham- & the Durham Freeway (147/I-885) to all points- in 5 minutes.
Home Details
Home Type
- Single Family
Est. Annual Taxes
- $2,641
Year Built
- Built in 1920 | Remodeled
Lot Details
- 5,000 Sq Ft Lot
- Lot Dimensions are 50' x 100'
- West Facing Home
- Corners Of The Lot Have Been Marked
- Partially Wooded Lot
- Property is zoned RU-5(2)
Property Views
- City Lights
- Neighborhood
Home Design
- Craftsman Architecture
- Cottage
- Entry on the 1st floor
- Brick Foundation
- Architectural Shingle Roof
- Asphalt Roof
- Wood Siding
- Lead Paint Disclosure
Interior Spaces
- 1,761 Sq Ft Home
- 1-Story Property
- Open Floorplan
- Smooth Ceilings
- Ceiling Fan
- Recessed Lighting
- Double Pane Windows
- Insulated Windows
- Window Screens
- Living Room
- Combination Kitchen and Dining Room
- Luxury Vinyl Tile Flooring
- Basement
- Crawl Space
Kitchen
- Electric Oven
- Electric Cooktop
- Range Hood
- Microwave
- Dishwasher
- Kitchen Island
- Quartz Countertops
Bedrooms and Bathrooms
- 4 Bedrooms | 1 Primary Bedroom on Main
- Walk-In Closet
- 2 Full Bathrooms
- Bathtub with Shower
- Walk-in Shower
Laundry
- Laundry Room
- Laundry on lower level
- Sink Near Laundry
- Washer and Electric Dryer Hookup
Attic
- Pull Down Stairs to Attic
- Unfinished Attic
Home Security
- Carbon Monoxide Detectors
- Fire and Smoke Detector
Parking
- 1 Parking Space
- Gravel Driveway
- Unpaved Parking
- On-Street Parking
- 1 Open Parking Space
- Off-Street Parking
Outdoor Features
- Deck
- Covered Patio or Porch
- Rain Gutters
Location
- Property is near public transit
- Suburban Location
- The property is located in a historic district
Schools
- Eastway Elementary School
- Neal Middle School
- Northern High School
Utilities
- Central Heating and Cooling System
- Heat Pump System
- Cable TV Available
Listing and Financial Details
- Assessor Parcel Number 0831-55-3981
Community Details
Overview
- No Home Owners Association
- Driver Land Subdivision
Amenities
- Restaurant
Recreation
- Community Playground
- Park
Map
Home Values in the Area
Average Home Value in this Area
Tax History
| Year | Tax Paid | Tax Assessment Tax Assessment Total Assessment is a certain percentage of the fair market value that is determined by local assessors to be the total taxable value of land and additions on the property. | Land | Improvement |
|---|---|---|---|---|
| 2025 | $2,618 | $264,084 | $99,900 | $164,184 |
| 2024 | $2,958 | $212,080 | $24,997 | $187,083 |
| 2023 | $2,778 | $212,080 | $24,997 | $187,083 |
| 2022 | $2,714 | $212,080 | $24,997 | $187,083 |
| 2021 | $2,719 | $213,475 | $26,392 | $187,083 |
| 2020 | $2,655 | $213,475 | $26,392 | $187,083 |
| 2019 | $2,655 | $213,475 | $26,392 | $187,083 |
| 2018 | $1,210 | $89,206 | $14,662 | $74,544 |
| 2017 | $1,201 | $89,206 | $14,662 | $74,544 |
| 2016 | $1,161 | $89,206 | $14,662 | $74,544 |
| 2015 | $540 | $39,000 | $11,314 | $27,686 |
| 2014 | $540 | $39,000 | $11,314 | $27,686 |
Property History
| Date | Event | Price | List to Sale | Price per Sq Ft |
|---|---|---|---|---|
| 02/11/2026 02/11/26 | Price Changed | $399,900 | -6.8% | $227 / Sq Ft |
| 02/04/2026 02/04/26 | Price Changed | $429,000 | -3.6% | $244 / Sq Ft |
| 01/07/2026 01/07/26 | Price Changed | $445,000 | -0.9% | $253 / Sq Ft |
| 10/17/2025 10/17/25 | Price Changed | $449,250 | -3.3% | $255 / Sq Ft |
| 09/29/2025 09/29/25 | Price Changed | $464,499 | -6.3% | $264 / Sq Ft |
| 09/25/2025 09/25/25 | For Sale | $495,808 | -- | $282 / Sq Ft |
Purchase History
| Date | Type | Sale Price | Title Company |
|---|---|---|---|
| Warranty Deed | -- | Trusttitle Insurance Co | |
| Warranty Deed | $90,000 | None Available | |
| Quit Claim Deed | $127,500 | None Available | |
| Warranty Deed | $72,000 | -- |
Mortgage History
| Date | Status | Loan Amount | Loan Type |
|---|---|---|---|
| Previous Owner | $88,900 | Purchase Money Mortgage |
Source: Doorify MLS
MLS Number: 10124034
APN: 112790
Disclaimer: Certain information contained herein is derived from information provided by parties other than Homes.com. All information provided is deemed reliable, but is not guaranteed to be accurate and should be independently verified.
![]() Some IDX listings have been excluded from this IDX display. Brokers make an effort to deliver accurate information, but buyers should independently verify any information on which they will rely in a transaction. The listing broker shall not be responsible for any typographical errors, misinformation, or misprints, and they shall be held totally harmless from any damages arising from reliance upon this data. This data is provided exclusively for consumers’ personal, non-commercial use. Listings marked with an icon are provided courtesy of the Doorify MLS, Inc. of North Carolina, Internet Data Exchange Database. Closed (sold) listings may have been listed and/or sold by a real estate firm other than the firm(s) featured on this website. Closed data is not available until the sale of the property is recorded in the MLS. Home sale data is not an appraisal, CMA, competitive or comparative market analysis, or home valuation of any property. Copyright 2026 Doorify MLS, Inc. of North Carolina. All rights reserved.
Some IDX listings have been excluded from this IDX display. Brokers make an effort to deliver accurate information, but buyers should independently verify any information on which they will rely in a transaction. The listing broker shall not be responsible for any typographical errors, misinformation, or misprints, and they shall be held totally harmless from any damages arising from reliance upon this data. This data is provided exclusively for consumers’ personal, non-commercial use. Listings marked with an icon are provided courtesy of the Doorify MLS, Inc. of North Carolina, Internet Data Exchange Database. Closed (sold) listings may have been listed and/or sold by a real estate firm other than the firm(s) featured on this website. Closed data is not available until the sale of the property is recorded in the MLS. Home sale data is not an appraisal, CMA, competitive or comparative market analysis, or home valuation of any property. Copyright 2026 Doorify MLS, Inc. of North Carolina. All rights reserved.
- 608 N Driver St
- 1704 Southgate St
- 604 Eastway Ave
- 1109 Eva St
- 521 Eastway Ave Unit B
- 1304 Holloway St
- 518 N Guthrie Ave
- 1006 Holloway St
- 1915 Taylor St
- 1501 Lathrop St
- 314 N Briggs Ave
- 1011 Park Ave
- 808 Eva St
- 1108 Taylor St
- 1704 Liberty St
- 808 Holloway St
- 1112 N Driver St
- 1401 Evergreen St
- 104 S Driver St
- 101 S Maple St
- 1202 Liberty St
- 600 N Hyde Park Ave Unit A
- 608 N Driver St
- 112 N Guthrie Ave Unit A
- 101 S Briggs Ave
- 1100 Hazel St
- 1405 Manteo St Unit A
- 1512 N Hyde Park Ave Unit 3
- 810 Dowd St Unit 27701
- 2408 Harvard Ave Unit Bedroom #1 w/Private Entrance
- 504 Holloway St
- 1607 Robinhood Rd
- 218 N Dillard St
- 927 Ramseur St
- 1332 Fidelity Dr
- 407 Ottawa Ave
- 500 E Main St
- 629 N Queen St
- 325 Dowd St
- 1603 Rosetta Dr
