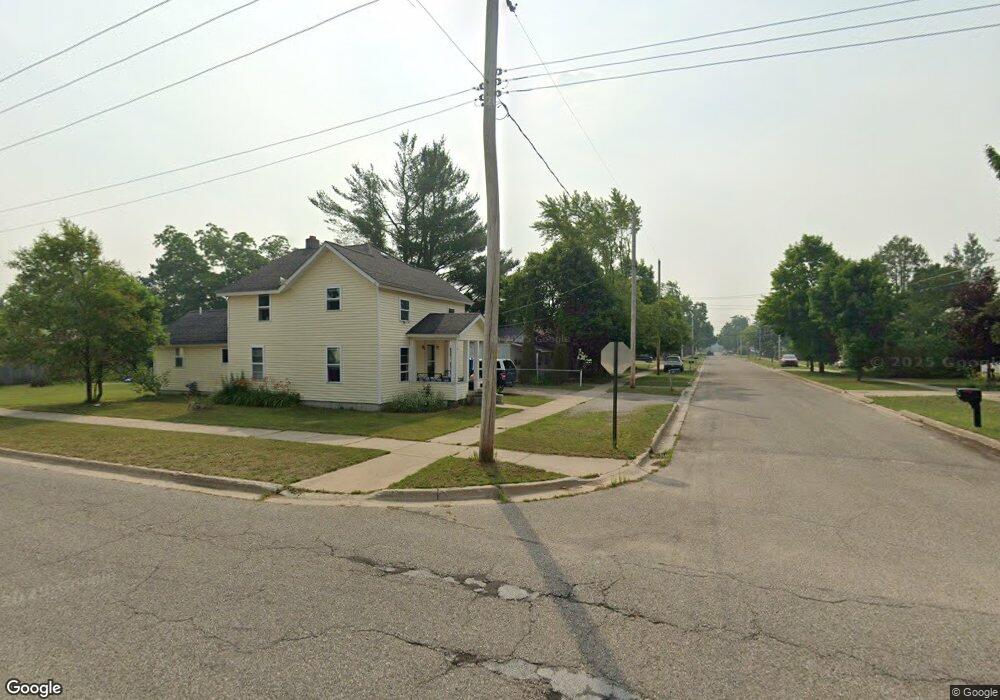
606 Park St Grayling, MI 49738
Estimated Value: $88,461 - $116,000
2
Beds
1
Bath
780
Sq Ft
$129/Sq Ft
Est. Value
About This Home
This home is located at 606 Park St, Grayling, MI 49738 and is currently estimated at $100,615, approximately $128 per square foot. 606 Park St is a home located in Crawford County with nearby schools including Grayling Elementary School, Grayling Middle School, and Grayling High School.
Ownership History
Date
Name
Owned For
Owner Type
Purchase Details
Closed on
Apr 23, 2009
Sold by
Latourneau Linda J Survivor
Bought by
Ruley Karyn J
Current Estimated Value
Purchase Details
Closed on
Apr 22, 2009
Sold by
Latourneau Linda J and Thayer Betty
Bought by
Ruley Karyn J
Purchase Details
Closed on
Jun 30, 2007
Sold by
Thayer Betty M
Bought by
Thayer Betty M
Purchase Details
Closed on
Jun 10, 1996
Bought by
Thayer Ivor and Wf Betty Marie
Purchase Details
Closed on
Jul 21, 1994
Purchase Details
Closed on
Sep 22, 1992
Sold by
Blashfield Charles H and Blashfield Lois M
Bought by
First National Acceptance Co
Purchase Details
Closed on
Feb 10, 1988
Sold by
Blashfield Charles H and Blashfield Lois M
Bought by
Thayer Evor and Betty Marie
Purchase Details
Closed on
Feb 21, 1986
Bought by
Harper Robert H and Harper Peggy L
Purchase Details
Closed on
Jun 10, 1980
Sold by
Harper Robert H and Harper Peggy L
Bought by
Hagle David E and Hagle Margaret A
Purchase Details
Closed on
Aug 23, 1973
Bought by
Blashfield Charles H and Blashfield Lois M
Create a Home Valuation Report for This Property
The Home Valuation Report is an in-depth analysis detailing your home's value as well as a comparison with similar homes in the area
Home Values in the Area
Average Home Value in this Area
Purchase History
| Date | Buyer | Sale Price | Title Company |
|---|---|---|---|
| Ruley Karyn J | $32,000 | -- | |
| Ruley Karyn J | $32,000 | -- | |
| Thayer Betty M | -- | -- | |
| Thayer Ivor | -- | -- | |
| -- | $25,000 | -- | |
| First National Acceptance Co | -- | -- | |
| Thayer Evor | $25,000 | -- | |
| Harper Robert H | $13,000 | -- | |
| Hagle David E | $20,500 | -- | |
| Blashfield Charles H | $14,500 | -- |
Source: Public Records
Tax History
| Year | Tax Paid | Tax Assessment Tax Assessment Total Assessment is a certain percentage of the fair market value that is determined by local assessors to be the total taxable value of land and additions on the property. | Land | Improvement |
|---|---|---|---|---|
| 2025 | $625 | $29,900 | $2,100 | $27,800 |
| 2024 | $608 | $27,800 | $2,100 | $25,700 |
| 2023 | $580 | $24,500 | $2,100 | $22,400 |
| 2022 | $553 | $19,300 | $2,100 | $17,200 |
| 2021 | $675 | $17,900 | $2,100 | $15,800 |
| 2020 | $665 | $17,500 | $2,100 | $15,400 |
| 2019 | $651 | $17,100 | $2,100 | $15,000 |
| 2018 | $639 | $14,900 | $2,100 | $12,800 |
| 2017 | $528 | $15,100 | $2,100 | $13,000 |
| 2016 | $523 | $14,000 | $2,100 | $11,900 |
| 2015 | -- | $14,000 | $0 | $0 |
| 2014 | -- | $14,600 | $0 | $0 |
| 2013 | -- | $15,500 | $0 | $0 |
Source: Public Records
Map
Nearby Homes
- 610 Spruce St
- 809 Maple St
- 403 Erie St
- 601 Peninsular Ave
- 1205 E Michigan Ave
- 1024 S I-75 Business Loop
- 205 Park St
- 110 State St
- 000 W M-72 Hwy
- 4593 Orbit Dr
- V/L L71-75 Evergreen Dr
- 300 Rolla St
- 5973 W M-72 Hwy
- V/L Lot 9 Norseman Dr
- V/L Lot 2 Norseman Dr
- V/L Lot 10 Norseman Dr
- V/L Lot 1 Norseman Dr
- 6364 Atkinson Rd
- 6960 Trem Pal Rd
- 4079 W Pinecrest Rd
Your Personal Tour Guide
Ask me questions while you tour the home.