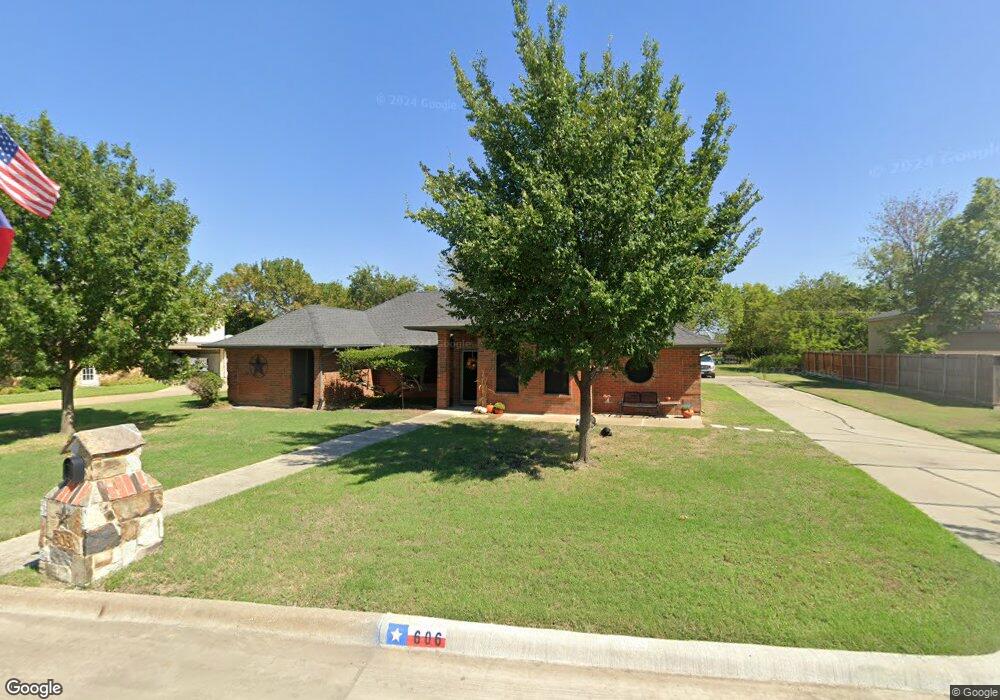
606 S Colorado St Celina, TX 75009
Estimated Value: $466,947 - $507,000
3
Beds
2
Baths
2,190
Sq Ft
$220/Sq Ft
Est. Value
About This Home
This home is located at 606 S Colorado St, Celina, TX 75009 and is currently estimated at $482,487, approximately $220 per square foot. 606 S Colorado St is a home located in Collin County with nearby schools including Celina Primary School, Marcy B. Lykins Elementary School, and Moore Middle School.
Ownership History
Date
Name
Owned For
Owner Type
Purchase Details
Closed on
Sep 7, 2000
Sold by
Sewall John A and Sewall Vanita
Bought by
Elliott Bill L and Elliott Linda G
Current Estimated Value
Home Financials for this Owner
Home Financials are based on the most recent Mortgage that was taken out on this home.
Original Mortgage
$80,000
Outstanding Balance
$29,281
Interest Rate
8.16%
Estimated Equity
$453,206
Purchase Details
Closed on
Jul 26, 1995
Sold by
Hunn Shane and Hunn Jennifer
Bought by
Sewall John A and Sewall Vanita A
Home Financials for this Owner
Home Financials are based on the most recent Mortgage that was taken out on this home.
Original Mortgage
$93,500
Interest Rate
7.51%
Purchase Details
Closed on
Sep 7, 1993
Sold by
Mcilroy James R and Mcilroy Virginia
Bought by
Stalling Joe E and Stalling Janice K
Home Financials for this Owner
Home Financials are based on the most recent Mortgage that was taken out on this home.
Original Mortgage
$16,500
Interest Rate
7.23%
Mortgage Type
Seller Take Back
Create a Home Valuation Report for This Property
The Home Valuation Report is an in-depth analysis detailing your home's value as well as a comparison with similar homes in the area
Home Values in the Area
Average Home Value in this Area
Purchase History
| Date | Buyer | Sale Price | Title Company |
|---|---|---|---|
| Elliott Bill L | -- | -- | |
| Sewall John A | -- | -- | |
| Stalling Joe E | -- | -- |
Source: Public Records
Mortgage History
| Date | Status | Borrower | Loan Amount |
|---|---|---|---|
| Open | Elliott Bill L | $80,000 | |
| Previous Owner | Sewall John A | $93,500 | |
| Previous Owner | Stalling Joe E | $16,500 |
Source: Public Records
Tax History Compared to Growth
Tax History
| Year | Tax Paid | Tax Assessment Tax Assessment Total Assessment is a certain percentage of the fair market value that is determined by local assessors to be the total taxable value of land and additions on the property. | Land | Improvement |
|---|---|---|---|---|
| 2025 | $1,511 | $397,519 | $178,250 | $265,274 |
| 2024 | $1,511 | $361,381 | $178,250 | $296,741 |
| 2023 | $1,511 | $328,528 | $138,000 | $365,530 |
| 2022 | $6,845 | $298,662 | $77,625 | $299,549 |
| 2021 | $6,340 | $313,621 | $67,275 | $246,346 |
| 2020 | $6,047 | $289,968 | $62,100 | $227,868 |
| 2019 | $5,715 | $224,389 | $62,100 | $181,493 |
| 2018 | $5,216 | $203,990 | $51,750 | $187,652 |
| 2017 | $4,742 | $198,426 | $46,575 | $151,851 |
| 2016 | $4,340 | $185,596 | $36,225 | $149,371 |
| 2015 | $2,910 | $160,495 | $36,225 | $124,270 |
Source: Public Records
Map
Nearby Homes
- 608 S Colorado St
- 604 S Colorado St
- 611 S Colorado St
- 613 S Colorado St
- 610 S Colorado St
- 609 S Colorado St
- 602 S Colorado St
- 615 S Colorado St
- 601 S Ohio Dr
- 614 S Colorado St
- 617 S Colorado St
- 618 S Arizona Dr
- 620 S Arizona Dr
- 622 S Arizona Dr
- 616 S Arizona Dr
- 520 S Colorado St
- 624 S Arizona Dr
- 614 S Arizona Dr
- 519 S Colorado St
- 626 S Arizona Dr