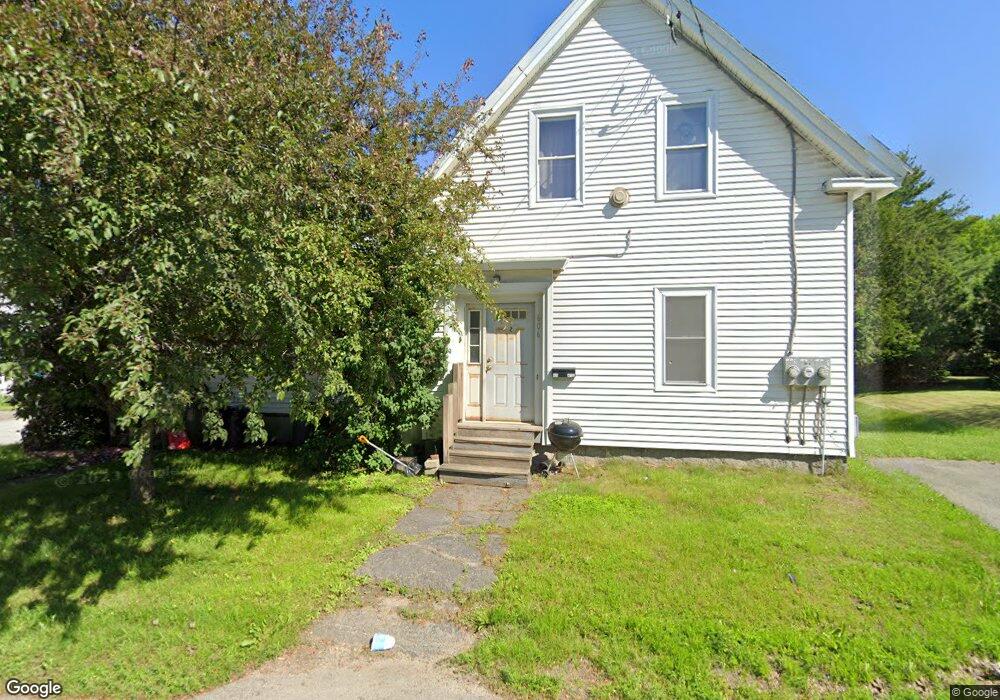
606 S Main St Unit 1 Brewer, ME 04412
Estimated Value: $215,000 - $286,000
2
Beds
1
Bath
1,676
Sq Ft
$146/Sq Ft
Est. Value
About This Home
This home is located at 606 S Main St Unit 1, Brewer, ME 04412 and is currently estimated at $244,840, approximately $146 per square foot. 606 S Main St Unit 1 is a home located in Penobscot County with nearby schools including Brewer Community School, Brewer High School, and Calvary Chapel Christian School.
Ownership History
Date
Name
Owned For
Owner Type
Purchase Details
Closed on
Sep 30, 2019
Sold by
Us Bank Na Tr
Bought by
Salt Pines Llc
Current Estimated Value
Purchase Details
Closed on
Jun 14, 2007
Sold by
Reaviel William F and Reaviel Amy
Bought by
Krug Timothy J
Home Financials for this Owner
Home Financials are based on the most recent Mortgage that was taken out on this home.
Original Mortgage
$133,371
Interest Rate
6.19%
Mortgage Type
FHA
Create a Home Valuation Report for This Property
The Home Valuation Report is an in-depth analysis detailing your home's value as well as a comparison with similar homes in the area
Home Values in the Area
Average Home Value in this Area
Purchase History
| Date | Buyer | Sale Price | Title Company |
|---|---|---|---|
| Salt Pines Llc | $65,000 | -- | |
| Krug Timothy J | -- | -- |
Source: Public Records
Mortgage History
| Date | Status | Borrower | Loan Amount |
|---|---|---|---|
| Previous Owner | Krug Timothy J | $135,327 | |
| Previous Owner | Krug Timothy J | $133,371 |
Source: Public Records
Tax History Compared to Growth
Tax History
| Year | Tax Paid | Tax Assessment Tax Assessment Total Assessment is a certain percentage of the fair market value that is determined by local assessors to be the total taxable value of land and additions on the property. | Land | Improvement |
|---|---|---|---|---|
| 2024 | $2,953 | $157,100 | $23,700 | $133,400 |
| 2023 | $2,878 | $143,200 | $21,900 | $121,300 |
| 2021 | $2,716 | $121,800 | $21,800 | $100,000 |
| 2020 | $2,239 | $98,400 | $21,800 | $76,600 |
| 2019 | $2,219 | $96,500 | $21,800 | $74,700 |
| 2018 | $2,171 | $96,500 | $21,800 | $74,700 |
| 2017 | $2,171 | $96,500 | $21,800 | $74,700 |
| 2016 | $2,068 | $96,100 | $21,800 | $74,300 |
| 2015 | $2,068 | $96,100 | $21,800 | $74,300 |
| 2014 | $2,010 | $96,100 | $21,800 | $74,300 |
| 2013 | $2,489 | $119,000 | $11,400 | $107,600 |
Source: Public Records
Map
Nearby Homes
- 10 Bald Eagle Dr Unit 10
- 15 Harbor Dr
- 185 Elm St
- 20 Patten Ct
- 53 Park Ave E
- 316 S Main St
- 224 Parkway S
- 71 Dillingham St
- Lot 89b Parkway S
- Lot 89A Parkway S
- LOT 89 Parkway S
- 33 Hillside Dr
- 99 Old County Rd
- 197 Arctic Station Rd
- Lot 3 00 Stonewall Dr
- Lot 4 00 Stonewall Dr
- 40 Walter St
- 8 Gibbons Ct
- 69 Walter St
- 8 Spring St
- 606 S Main St
- 600 S Main St Unit 1
- 3 Stone St
- 608 S Main St
- 0 Cove Road Town Landing Rd Unit 1023880
- 5 Stone St
- 596 S Main St
- 609 S Main St
- 620 S Main St
- 12 Stone St Unit 1A
- 12 Stone St Unit 3
- 590 S Main St
- 14 Stone St
- Lot 1D Elm St
- 26 Cove St
- 13 Elm St
- 13 Elm St
- 613 S South Main St
- 13 Elm St
- 613 S Main St