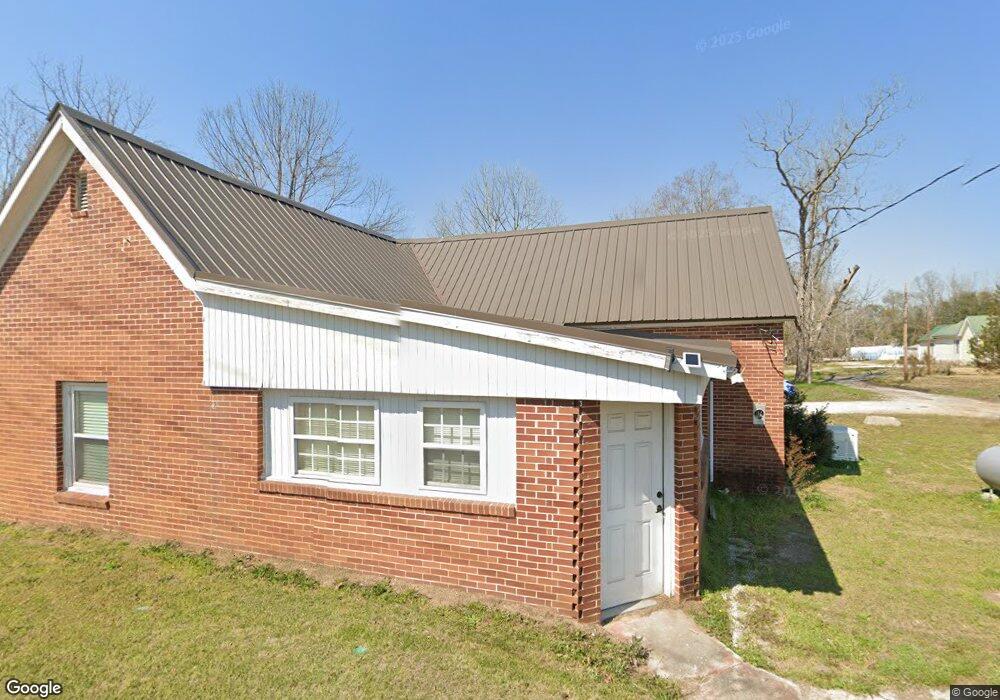
606 S Main St Davisboro, GA 31018
Estimated Value: $107,972 - $164,000
Studio
--
Bath
1,638
Sq Ft
$80/Sq Ft
Est. Value
About This Home
This home is located at 606 S Main St, Davisboro, GA 31018 and is currently estimated at $131,743, approximately $80 per square foot. 606 S Main St is a home located in Washington County with nearby schools including Ridge Road Primary School, Ridge Road Elementary School, and T.J. Elder Middle School.
Ownership History
Date
Name
Owned For
Owner Type
Purchase Details
Closed on
May 19, 2008
Sold by
Veal Christopher
Bought by
Farthing Thomas
Current Estimated Value
Home Financials for this Owner
Home Financials are based on the most recent Mortgage that was taken out on this home.
Original Mortgage
$35,237
Interest Rate
5.86%
Mortgage Type
New Conventional
Purchase Details
Closed on
Jan 2, 2007
Sold by
Kicklighter Glen D
Bought by
Veal Christopher Stuart
Purchase Details
Closed on
Jul 5, 2006
Sold by
Smith Randall S
Bought by
Veal Christopher Stuart and Kicklighter Glenn D
Purchase Details
Closed on
Jan 29, 2004
Sold by
Dallas Janet Fillett
Bought by
Smith Randall S and Smith Judy V
Purchase Details
Closed on
Jun 15, 1999
Sold by
Brooks Douglas Mrs Estate
Bought by
Dallas Janet Fillett
Purchase Details
Closed on
Jun 5, 1961
Bought by
Brooks Douglas Mrs
Create a Home Valuation Report for This Property
The Home Valuation Report is an in-depth analysis detailing your home's value as well as a comparison with similar homes in the area
Purchase History
| Date | Buyer | Sale Price | Title Company |
|---|---|---|---|
| Farthing Thomas | $45,000 | -- | |
| Veal Christopher Stuart | -- | -- | |
| Veal Christopher Stuart | $28,000 | -- | |
| Smith Randall S | $30,000 | -- | |
| Dallas Janet Fillett | -- | -- | |
| Brooks Douglas Mrs | $200 | -- |
Source: Public Records
Mortgage History
| Date | Status | Borrower | Loan Amount |
|---|---|---|---|
| Closed | Farthing Thomas | $35,237 |
Source: Public Records
Tax History
| Year | Tax Paid | Tax Assessment Tax Assessment Total Assessment is a certain percentage of the fair market value that is determined by local assessors to be the total taxable value of land and additions on the property. | Land | Improvement |
|---|---|---|---|---|
| 2025 | $1,042 | $35,760 | $2,200 | $33,560 |
| 2024 | $1,289 | $35,760 | $2,200 | $33,560 |
| 2023 | $267 | $25,680 | $2,200 | $23,480 |
| 2022 | $820 | $25,680 | $2,200 | $23,480 |
| 2021 | $840 | $25,680 | $2,200 | $23,480 |
| 2020 | $846 | $25,680 | $2,200 | $23,480 |
| 2019 | $845 | $25,680 | $2,200 | $23,480 |
| 2018 | $846 | $25,680 | $2,200 | $23,480 |
| 2017 | $523 | $17,095 | $1,062 | $16,033 |
| 2016 | $536 | $17,095 | $1,062 | $16,033 |
| 2015 | $482 | $806 | $1,062 | $16,033 |
| 2014 | $482 | $17,686 | $1,654 | $16,033 |
| 2013 | $482 | $17,686 | $1,653 | $16,032 |
Source: Public Records
Map
Nearby Homes
- Lt.1 Harrison-Davisboro Rd
- 3033 Freetown Rd
- 7 Sun Hill Grange Rd
- 4 Sun Hill Grange Rd
- 0 Glover Rd
- 9357 E Highway 242
- 0 Belmont Rd N Unit 10684732
- 265 Jordan Meadow Ln
- Tbd Belmont Rd
- 8849 Sunhill Rd
- 00 Henderson Grove Rd
- 3195 Henderson Grove Rd
- 1102 Friendship Church Rd
- 2905 Donald Cobb Rd
- 2160 Donald Cobb Rd
- 3700 Salter Rd
- 0 Newman Smith Rd Unit 10573699
- 0 Newman Smith Rd Unit 24281399
- 0 Mathis Rd Unit 10677378
- 0 Mathis Rd Unit 54347
- 137 Brooks St
- 111 Brooks St
- 642 S Main St
- 205 W Mccoy St
- 643 S Main St
- 207 W Mccoy St
- 213 Martin Luther King jr St
- 661 S Main St
- NORTH Main
- 655 S Main St
- 217 Martin Luther King jr St
- 676 S Main St
- 203 E Railroad St
- 223 Martin Luther King jr St
- 211 W Mccoy St
- 219 W Mccoy St
- 661 Highway 231
- 208 S Main St
- 103 E Railroad St
- 706 S Main St
Your Personal Tour Guide
Ask me questions while you tour the home.