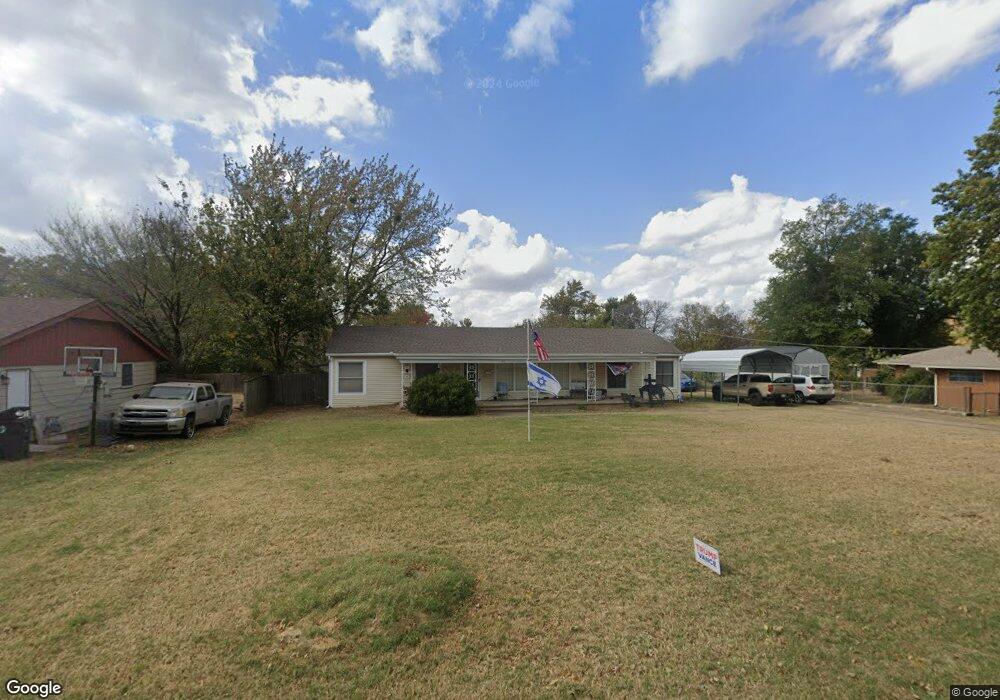
606 S Wilson Ave Okmulgee, OK 74447
Estimated Value: $125,000 - $182,000
3
Beds
2
Baths
1,804
Sq Ft
$85/Sq Ft
Est. Value
About This Home
This home is located at 606 S Wilson Ave, Okmulgee, OK 74447 and is currently estimated at $152,946, approximately $84 per square foot. 606 S Wilson Ave is a home located in Okmulgee County with nearby schools including Okmulgee Primary School, Dunbar Elementary School, and Okmulgee Middle School.
Ownership History
Date
Name
Owned For
Owner Type
Purchase Details
Closed on
May 30, 2025
Sold by
Hagy Devon L
Bought by
Hagy Devon L
Current Estimated Value
Purchase Details
Closed on
Mar 30, 2009
Sold by
Rogers Kenny Ray and Rogers Beth A
Bought by
Hagy Devon L
Home Financials for this Owner
Home Financials are based on the most recent Mortgage that was taken out on this home.
Original Mortgage
$89,351
Interest Rate
5.21%
Mortgage Type
FHA
Purchase Details
Closed on
Aug 10, 2005
Sold by
Rogers Misty Amber
Bought by
Rogers Kenny Ray
Purchase Details
Closed on
May 16, 2005
Sold by
Rogers Kenny R and Rogers Misty A
Bought by
Rogers Kenny R
Home Financials for this Owner
Home Financials are based on the most recent Mortgage that was taken out on this home.
Original Mortgage
$72,000
Interest Rate
5.87%
Mortgage Type
New Conventional
Create a Home Valuation Report for This Property
The Home Valuation Report is an in-depth analysis detailing your home's value as well as a comparison with similar homes in the area
Home Values in the Area
Average Home Value in this Area
Purchase History
| Date | Buyer | Sale Price | Title Company |
|---|---|---|---|
| Hagy Devon L | -- | None Listed On Document | |
| Hagy Devon L | -- | None Listed On Document | |
| Hagy Devon L | $91,000 | None Available | |
| Rogers Kenny Ray | -- | None Available | |
| Rogers Kenny R | -- | First American Title Insuran |
Source: Public Records
Mortgage History
| Date | Status | Borrower | Loan Amount |
|---|---|---|---|
| Previous Owner | Hagy Devon L | $89,351 | |
| Previous Owner | Rogers Kenny R | $72,000 |
Source: Public Records
Tax History Compared to Growth
Tax History
| Year | Tax Paid | Tax Assessment Tax Assessment Total Assessment is a certain percentage of the fair market value that is determined by local assessors to be the total taxable value of land and additions on the property. | Land | Improvement |
|---|---|---|---|---|
| 2025 | -- | $8,609 | $792 | $7,817 |
| 2024 | -- | $8,358 | $792 | $7,566 |
| 2023 | $0 | $10,179 | $792 | $9,387 |
| 2022 | $0 | $10,179 | $792 | $9,387 |
| 2021 | $846 | $10,179 | $792 | $9,387 |
| 2020 | $846 | $9,583 | $792 | $8,791 |
| 2019 | $806 | $9,127 | $792 | $8,335 |
| 2018 | $778 | $8,692 | $792 | $7,900 |
| 2017 | $0 | $8,278 | $792 | $7,486 |
| 2016 | $625 | $8,038 | $792 | $7,246 |
| 2015 | $774 | $8,986 | $792 | $8,194 |
| 2014 | $946 | $10,920 | $792 | $10,128 |
Source: Public Records
Map
Nearby Homes
- 608 S Wilson Ave
- 600 S Wilson Ave
- 607 S Lincoln Ave
- 1334 E 11th St
- 1337 E 12th St
- 605 S Wilson Ave
- 609 S Lincoln Ave
- 601 S Lincoln Ave
- 601 S Wilson Ave
- 615 S Wilson Ave
- 1345 E 11th St
- 1401 E 12th St
- 1335 E 11th St
- 511 S Wilson Ave
- 1333 E 11th St
- 516 S Locust Ave
- 604 S Lincoln Ave
- 608 S Lincoln Ave
- 614 S Locust Ave
- 512 S Locust Ave