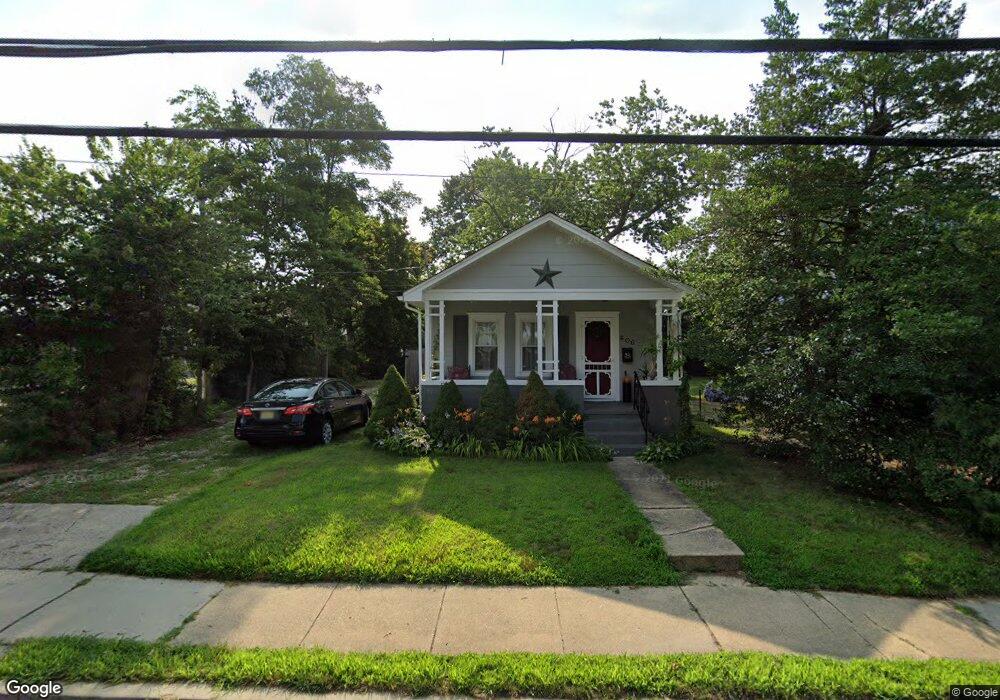
606 State Route 71 Spring Lake, NJ 07762
Estimated Value: $742,000 - $929,000
2
Beds
1
Bath
576
Sq Ft
$1,507/Sq Ft
Est. Value
About This Home
This home is located at 606 State Route 71, Spring Lake, NJ 07762 and is currently estimated at $867,867, approximately $1,506 per square foot. 606 State Route 71 is a home located in Monmouth County with nearby schools including Spring Lake Heights Elementary School and St. Catharine School.
Ownership History
Date
Name
Owned For
Owner Type
Purchase Details
Closed on
May 21, 2010
Sold by
Neal Susan
Bought by
Brojock John M and Brojock Donna J
Current Estimated Value
Home Financials for this Owner
Home Financials are based on the most recent Mortgage that was taken out on this home.
Original Mortgage
$200,000
Outstanding Balance
$134,576
Interest Rate
5.13%
Mortgage Type
New Conventional
Estimated Equity
$733,291
Purchase Details
Closed on
Aug 7, 2008
Sold by
Neal Susan
Bought by
Neal Susan
Purchase Details
Closed on
Nov 24, 2004
Sold by
Rankin Caren
Bought by
Wise Howard and Wise Helen
Purchase Details
Closed on
Sep 11, 2001
Sold by
Carlet Sandra
Bought by
Rankin Caren
Home Financials for this Owner
Home Financials are based on the most recent Mortgage that was taken out on this home.
Original Mortgage
$162,000
Interest Rate
6.93%
Create a Home Valuation Report for This Property
The Home Valuation Report is an in-depth analysis detailing your home's value as well as a comparison with similar homes in the area
Home Values in the Area
Average Home Value in this Area
Purchase History
| Date | Buyer | Sale Price | Title Company |
|---|---|---|---|
| Brojock John M | $250,000 | Stewart Title Guaranty Co | |
| Neal Susan | -- | None Available | |
| Wise Howard | $374,000 | -- | |
| Rankin Caren | $180,000 | -- |
Source: Public Records
Mortgage History
| Date | Status | Borrower | Loan Amount |
|---|---|---|---|
| Open | Brojock John M | $200,000 | |
| Previous Owner | Rankin Caren | $162,000 |
Source: Public Records
Tax History Compared to Growth
Tax History
| Year | Tax Paid | Tax Assessment Tax Assessment Total Assessment is a certain percentage of the fair market value that is determined by local assessors to be the total taxable value of land and additions on the property. | Land | Improvement |
|---|---|---|---|---|
| 2025 | $7,694 | $811,000 | $631,800 | $179,200 |
| 2024 | $6,842 | $730,700 | $608,400 | $122,300 |
| 2023 | $6,842 | $610,900 | $491,400 | $119,500 |
| 2022 | $5,612 | $469,600 | $347,000 | $122,600 |
| 2021 | $5,612 | $415,700 | $300,600 | $115,100 |
| 2020 | $5,501 | $405,100 | $300,600 | $104,500 |
| 2019 | $5,517 | $402,100 | $300,600 | $101,500 |
| 2018 | $5,562 | $394,500 | $300,600 | $93,900 |
| 2017 | $5,398 | $396,900 | $304,200 | $92,700 |
| 2016 | $5,438 | $394,900 | $304,200 | $90,700 |
| 2015 | $5,260 | $383,100 | $294,800 | $88,300 |
| 2014 | $4,698 | $349,800 | $262,100 | $87,700 |
Source: Public Records
Map
Nearby Homes
- 530 Highway 71 Unit 4
- 613 Warren Ave
- 513 Mercer Ave
- 418 Monmouth Ave
- 418 Salem Ave
- 601 Central Ave
- 817 Ocean Rd
- 305 4th Ave
- 19 Willow Ln
- 805 Jersey Ave
- 306 Ocean Rd
- 200 Monmouth Ave Unit 21
- 200 Monmouth Ave Unit 19
- 200 Monmouth Ave Unit 27
- 200 Monmouth Ave Unit 23
- 200 Monmouth Ave Unit 5
- 1301 Warren Ave Unit 5
- 118 Warren Ave
- 12 Wyckham Rd
- 15 Wyckham Rd
- 604 State Route 71
- 600 New Jersey 71 Unit 10
- 600 New Jersey 71 Unit 4
- 600 New Jersey 71 Unit 3
- 600 New Jersey 71 Unit 11
- 621 Essex Ave
- 620 Monmouth Ave
- 600 State Route 71 Unit 3
- 600 State Route 71 Unit 5
- 600 State Route 71 Unit 2
- 600 Highway 71 Unit 4
- 600 State Route 71 Unit 10
- 600 State Route 71 Unit 11
- 600-602 New Jersey 71 Unit 4
- 619 Essex Ave
- 616 Monmouth Ave
- 617 Essex Ave
- 614 Monmouth Ave
- 615A Essex Ave
- 615 Essex Ave