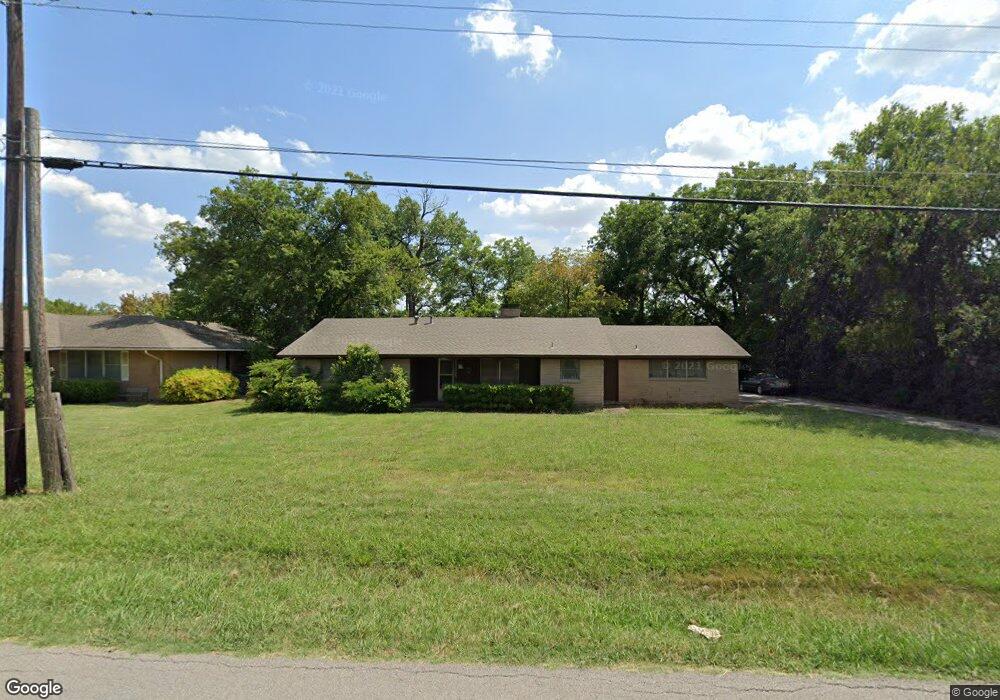
606 W Ash St Celina, TX 75009
Estimated Value: $308,123 - $349,000
3
Beds
2
Baths
1,286
Sq Ft
$255/Sq Ft
Est. Value
About This Home
This home is located at 606 W Ash St, Celina, TX 75009 and is currently estimated at $327,781, approximately $254 per square foot. 606 W Ash St is a home located in Collin County with nearby schools including Celina Primary School, Marcy B. Lykins Elementary School, and Moore Middle School.
Ownership History
Date
Name
Owned For
Owner Type
Purchase Details
Closed on
Dec 7, 2007
Sold by
Ferguson Nancy Jane and Rue Grover C
Bought by
Rue Grover C and Grover C Rue Jr Exempt Trust
Current Estimated Value
Purchase Details
Closed on
Feb 28, 2006
Sold by
Stallcup David Byron and Kenley Nancy
Bought by
The First Methodist Church Of Celina
Purchase Details
Closed on
Jan 24, 2006
Sold by
Stallcup David Byron and Kenley Nancy
Bought by
Stallcup David Byron and Kenley Nancy
Create a Home Valuation Report for This Property
The Home Valuation Report is an in-depth analysis detailing your home's value as well as a comparison with similar homes in the area
Home Values in the Area
Average Home Value in this Area
Purchase History
| Date | Buyer | Sale Price | Title Company |
|---|---|---|---|
| Rue Grover C | -- | None Available | |
| Ferguson Nancy Jane | -- | None Available | |
| The First Methodist Church Of Celina | -- | None Available | |
| Stallcup David Byron | -- | None Available |
Source: Public Records
Tax History
| Year | Tax Paid | Tax Assessment Tax Assessment Total Assessment is a certain percentage of the fair market value that is determined by local assessors to be the total taxable value of land and additions on the property. | Land | Improvement |
|---|---|---|---|---|
| 2025 | $6,048 | $310,336 | $198,000 | $112,336 |
| 2024 | $5,799 | $280,866 | $165,000 | $115,866 |
| 2023 | $5,799 | $255,431 | $132,000 | $123,431 |
| 2022 | $4,617 | $201,444 | $80,000 | $121,444 |
| 2021 | $1,499 | $64,192 | $20,000 | $44,192 |
| 2020 | $1,532 | $62,547 | $20,000 | $42,547 |
| 2019 | $1,629 | $63,949 | $20,000 | $43,949 |
| 2018 | $1,309 | $51,182 | $12,500 | $38,682 |
| 2017 | $1,394 | $54,508 | $12,500 | $42,008 |
| 2016 | $1,315 | $51,087 | $12,500 | $38,587 |
| 2015 | $723 | $43,970 | $0 | $0 |
Source: Public Records
Map
Nearby Homes
- 516 S Alabama St
- 509 W Ash St
- 910 Derby Ct
- 528 S Alabama Dr
- 309 S Arizona Dr
- 950 W Ash St
- 612 S Arizona Dr
- 716 W Main St
- 750 Stefhanie Dr
- 949 W Sunset Blvd
- 416 Badlands Trail
- 1101 Bryce Canyon Dr
- 309 S Louisiana St
- 520 Zion Pkwy
- 212 N Arizona Dr
- 109 S Hillside St
- 1213 Glacier Ct
- 311 N Illinois St
- 305 N Arizona Dr
- 413 Yellowstone Dr
Your Personal Tour Guide
Ask me questions while you tour the home.