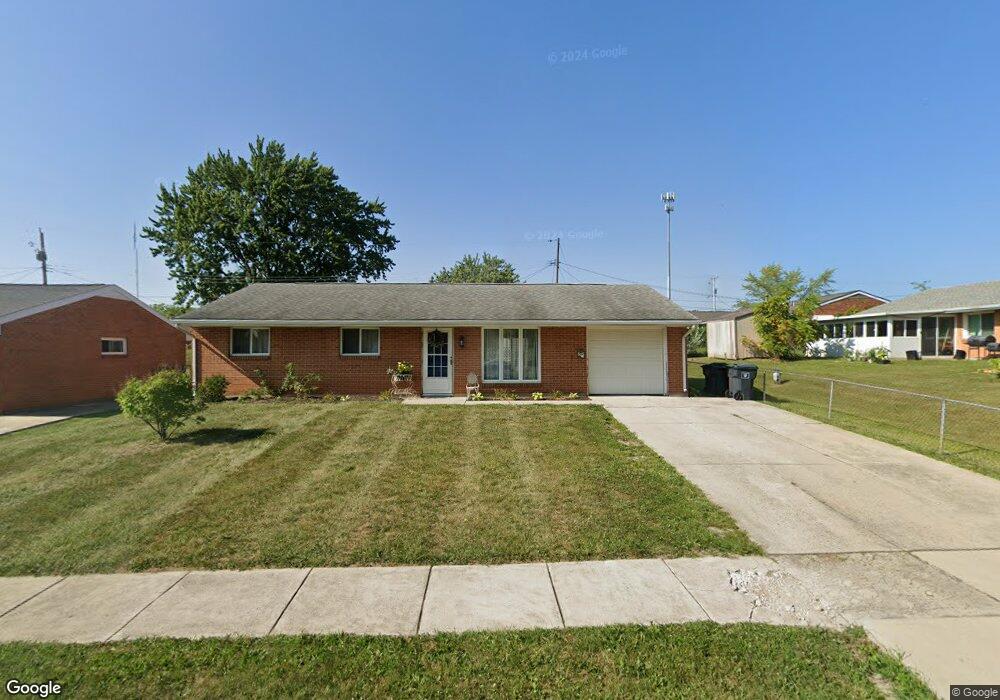
606 W Chapman Ave Lima, OH 45801
Northside Lima NeighborhoodEstimated Value: $115,000 - $166,000
3
Beds
1
Bath
1,148
Sq Ft
$125/Sq Ft
Est. Value
About This Home
This home is located at 606 W Chapman Ave, Lima, OH 45801 and is currently estimated at $143,795, approximately $125 per square foot. 606 W Chapman Ave is a home located in Allen County with nearby schools including Elida Elementary School, Elida Middle School, and Elida High School.
Ownership History
Date
Name
Owned For
Owner Type
Purchase Details
Closed on
Apr 20, 2023
Sold by
Hayes Christi R and Hayes Anthony
Bought by
Booher Megan L and Booher Kevin R
Current Estimated Value
Purchase Details
Closed on
Dec 11, 2014
Sold by
Nice Marc D and Nice Lacey C
Bought by
Hayes Christi R
Home Financials for this Owner
Home Financials are based on the most recent Mortgage that was taken out on this home.
Original Mortgage
$47,200
Interest Rate
3.97%
Mortgage Type
Purchase Money Mortgage
Purchase Details
Closed on
May 14, 2010
Sold by
Heaston Richard Alan and Heaston Jane S
Bought by
Nice Marc D and Nice Lacey C
Home Financials for this Owner
Home Financials are based on the most recent Mortgage that was taken out on this home.
Original Mortgage
$52,000
Interest Rate
5.3%
Mortgage Type
Purchase Money Mortgage
Purchase Details
Closed on
Sep 11, 2009
Sold by
Heaston Richard Alan and Heaston L
Bought by
Heaston Richard Alan and Heaston L
Purchase Details
Closed on
Sep 28, 1987
Bought by
Heaston Grace C
Create a Home Valuation Report for This Property
The Home Valuation Report is an in-depth analysis detailing your home's value as well as a comparison with similar homes in the area
Home Values in the Area
Average Home Value in this Area
Purchase History
| Date | Buyer | Sale Price | Title Company |
|---|---|---|---|
| Booher Megan L | $93,500 | None Listed On Document | |
| Hayes Christi R | $67,500 | None Available | |
| Nice Marc D | $67,600 | Attorney | |
| Heaston Richard Alan | -- | Attorney | |
| Heaston Grace C | -- | -- |
Source: Public Records
Mortgage History
| Date | Status | Borrower | Loan Amount |
|---|---|---|---|
| Previous Owner | Hayes Christi R | $47,200 | |
| Previous Owner | Nice Marc D | $52,000 |
Source: Public Records
Tax History Compared to Growth
Tax History
| Year | Tax Paid | Tax Assessment Tax Assessment Total Assessment is a certain percentage of the fair market value that is determined by local assessors to be the total taxable value of land and additions on the property. | Land | Improvement |
|---|---|---|---|---|
| 2024 | $1,583 | $38,150 | $4,760 | $33,390 |
| 2023 | $1,289 | $27,830 | $3,470 | $24,360 |
| 2022 | $1,309 | $27,830 | $3,470 | $24,360 |
| 2021 | $1,316 | $27,830 | $3,470 | $24,360 |
| 2020 | $1,178 | $23,350 | $3,330 | $20,020 |
| 2019 | $1,178 | $23,350 | $3,330 | $20,020 |
| 2018 | $1,110 | $23,350 | $3,330 | $20,020 |
| 2017 | $1,023 | $21,040 | $3,330 | $17,710 |
| 2016 | $1,021 | $21,040 | $3,330 | $17,710 |
| 2015 | $949 | $21,040 | $3,330 | $17,710 |
| 2014 | $949 | $18,800 | $3,150 | $15,650 |
| 2013 | $922 | $18,800 | $3,150 | $15,650 |
Source: Public Records
Map
Nearby Homes
- 2104 Virginia Ave
- 700 Lewis Blvd
- 1776 Virginia Ave
- 168 Lyre Bird Ln
- 400 W Northern Ave
- 2370 N McDonel St
- 2371 Mandolin Dr
- 105 Watt Ave
- 128 E Lane Ave
- 610 W Robb Ave
- 340 W Robb Ave
- 608 W O'Connor Ave
- 1200 N Main St
- 765 W O'Connor Ave
- 849 Runyan Ave
- 2630 Carolyn Dr
- 1116 Belvidere Ave
- 2718 Carolyn Dr
- 939 N West St
- 0 Sherman Ave