Estimated Value: $543,000 - $641,000
3
Beds
2
Baths
2,028
Sq Ft
$292/Sq Ft
Est. Value
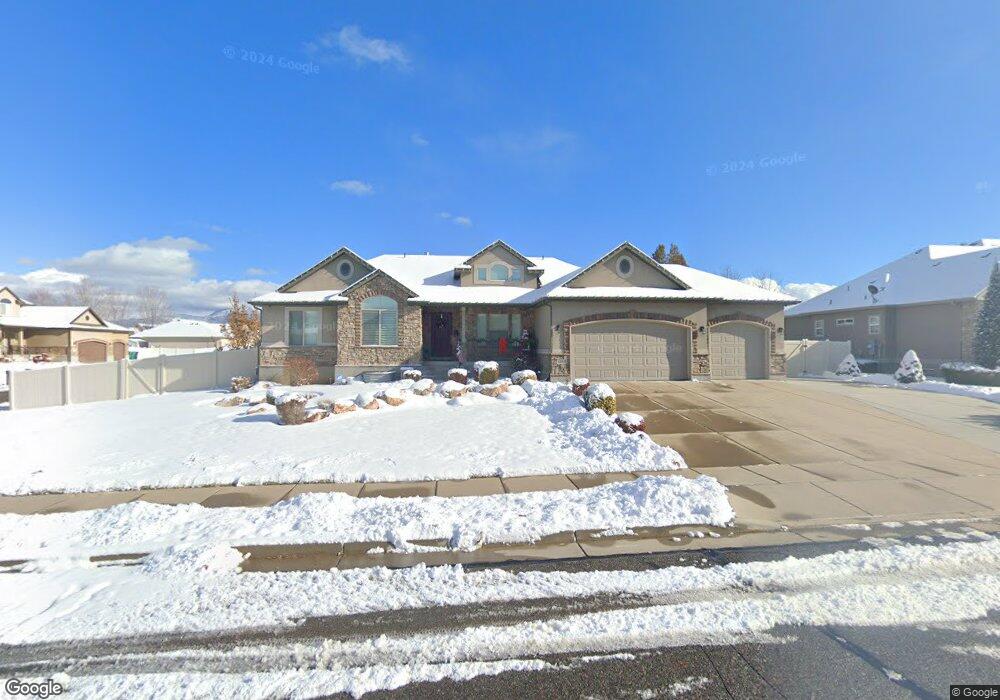
About This Home
This home is located at 6060 S 3950 W, Roy, UT 84067 and is currently estimated at $591,543, approximately $291 per square foot. 6060 S 3950 W is a home with nearby schools including Freedom School, Roy Junior High School, and Roy High School.
Ownership History
Date
Name
Owned For
Owner Type
Purchase Details
Closed on
Dec 5, 2006
Sold by
Gmw Development Inc
Bought by
Bolton Derrick L and Bolton Donna M
Current Estimated Value
Home Financials for this Owner
Home Financials are based on the most recent Mortgage that was taken out on this home.
Original Mortgage
$50,950
Outstanding Balance
$30,496
Interest Rate
6.33%
Mortgage Type
Unknown
Estimated Equity
$561,047
Create a Home Valuation Report for This Property
The Home Valuation Report is an in-depth analysis detailing your home's value as well as a comparison with similar homes in the area
Home Values in the Area
Average Home Value in this Area
Purchase History
| Date | Buyer | Sale Price | Title Company |
|---|---|---|---|
| Bolton Derrick L | -- | Cottonwood Title Insurance A |
Source: Public Records
Mortgage History
| Date | Status | Borrower | Loan Amount |
|---|---|---|---|
| Open | Bolton Derrick L | $50,950 | |
| Open | Bolton Derrick L | $271,956 |
Source: Public Records
Tax History
| Year | Tax Paid | Tax Assessment Tax Assessment Total Assessment is a certain percentage of the fair market value that is determined by local assessors to be the total taxable value of land and additions on the property. | Land | Improvement |
|---|---|---|---|---|
| 2025 | $288 | $629,013 | $185,003 | $444,010 |
| 2024 | $3,243 | $618,000 | $184,820 | $433,180 |
| 2023 | $3,137 | $597,000 | $184,921 | $412,079 |
| 2022 | $3,355 | $614,000 | $124,893 | $489,107 |
| 2021 | $2,843 | $482,000 | $84,939 | $397,061 |
| 2020 | $2,659 | $420,000 | $84,939 | $335,061 |
| 2019 | $2,513 | $378,000 | $69,669 | $308,331 |
| 2018 | $2,275 | $327,000 | $64,754 | $262,246 |
| 2017 | $2,132 | $292,000 | $61,806 | $230,194 |
| 2016 | $2,086 | $154,929 | $35,460 | $119,469 |
| 2015 | $1,938 | $148,585 | $32,725 | $115,860 |
| 2014 | $2,255 | $144,374 | $32,892 | $111,482 |
Source: Public Records
Map
Nearby Homes
- 4062 W 5950 S
- 2216 W 2615 N Unit 142
- 2208 W 2615 N
- 2208 W 2615 N Unit 141
- 2186 W 2615 N
- 2186 W 2615 N Unit 139
- 6052 S 4275 W
- 4264 W 6025 S
- 2606 N 2125 W
- 2606 N 2125 W Unit 149
- 2602 N 2125 W
- 2602 N 2125 W Unit 150
- 2596 N 2125 W Unit 151
- 2596 N 2125 W
- 4276 W 6025 S
- 2566 N 2125 W
- 3826 W 5750 S
- 3016 W 2650 N
- 3186 W 2600 N
- 2434 W 2250 N
Your Personal Tour Guide
Ask me questions while you tour the home.