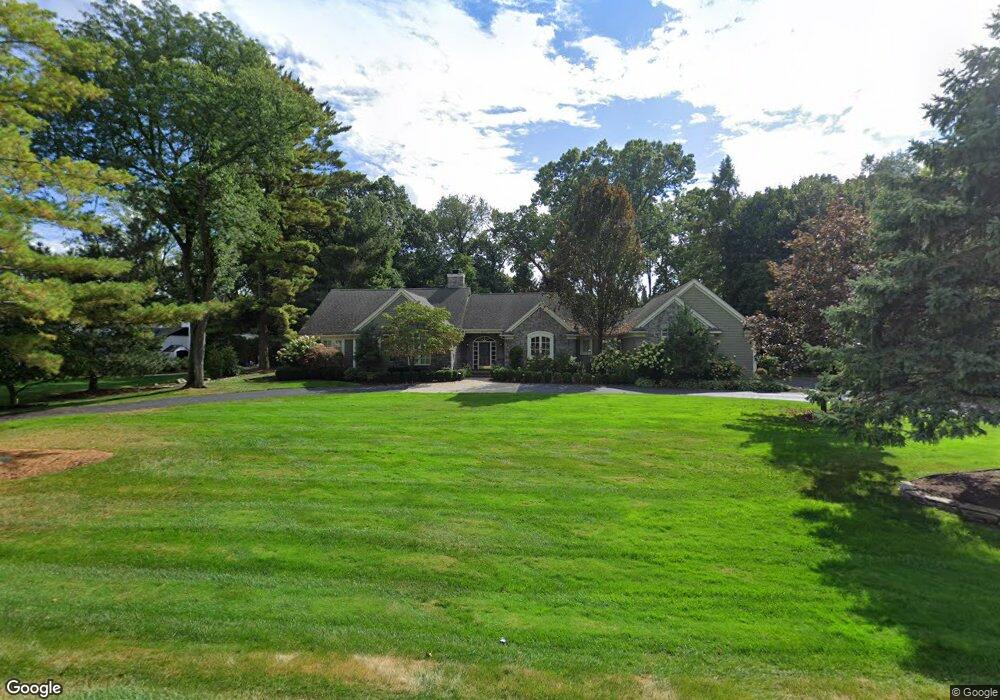
6060 Snowshoe Cir Bloomfield Hills, MI 48301
Estimated Value: $995,000 - $1,324,000
3
Beds
4
Baths
3,302
Sq Ft
$360/Sq Ft
Est. Value
About This Home
This home is located at 6060 Snowshoe Cir, Bloomfield Hills, MI 48301 and is currently estimated at $1,187,853, approximately $359 per square foot. 6060 Snowshoe Cir is a home located in Oakland County with nearby schools including Conant Elementary School, South Hills Middle School, and Bloomfield Hills High School.
Ownership History
Date
Name
Owned For
Owner Type
Purchase Details
Closed on
Oct 29, 2021
Sold by
Foley John Peter and Fole Mary
Bought by
Moore Thomas G and Moore Mary Catherine
Current Estimated Value
Purchase Details
Closed on
Sep 21, 2018
Sold by
Foley John P and Foley Mary C
Bought by
Foley John Peter and Foley Mary Catherine
Purchase Details
Closed on
Jan 14, 2011
Sold by
Foley John Peter and Foley Mary C
Bought by
Foley John P and Foley Mary C
Home Financials for this Owner
Home Financials are based on the most recent Mortgage that was taken out on this home.
Original Mortgage
$415,000
Interest Rate
4.82%
Mortgage Type
New Conventional
Purchase Details
Closed on
Jan 15, 1999
Sold by
Robert A Grierson Tr
Bought by
Foley John Peter
Purchase Details
Closed on
Mar 22, 1996
Sold by
Grierson Robert A
Bought by
Robert A Grierson Tr
Create a Home Valuation Report for This Property
The Home Valuation Report is an in-depth analysis detailing your home's value as well as a comparison with similar homes in the area
Home Values in the Area
Average Home Value in this Area
Purchase History
| Date | Buyer | Sale Price | Title Company |
|---|---|---|---|
| Moore Thomas G | -- | None Listed On Document | |
| Foley John Peter | -- | None Available | |
| Foley John P | -- | None Available | |
| Foley John Peter | $283,000 | -- | |
| Robert A Grierson Tr | -- | -- |
Source: Public Records
Mortgage History
| Date | Status | Borrower | Loan Amount |
|---|---|---|---|
| Previous Owner | Foley John P | $415,000 |
Source: Public Records
Tax History Compared to Growth
Tax History
| Year | Tax Paid | Tax Assessment Tax Assessment Total Assessment is a certain percentage of the fair market value that is determined by local assessors to be the total taxable value of land and additions on the property. | Land | Improvement |
|---|---|---|---|---|
| 2024 | $5,917 | $549,090 | $0 | $0 |
| 2023 | $5,726 | $503,710 | $0 | $0 |
| 2022 | $10,761 | $469,310 | $0 | $0 |
| 2021 | $10,684 | $410,530 | $0 | $0 |
| 2020 | $5,237 | $374,640 | $0 | $0 |
| 2019 | $10,053 | $360,960 | $0 | $0 |
| 2018 | $10,099 | $340,470 | $0 | $0 |
| 2017 | $10,129 | $333,770 | $0 | $0 |
| 2016 | $10,045 | $325,950 | $0 | $0 |
| 2015 | -- | $312,470 | $0 | $0 |
| 2014 | -- | $280,860 | $0 | $0 |
| 2011 | -- | $235,240 | $0 | $0 |
Source: Public Records
Map
Nearby Homes
- 5741 Snowshoe Cir
- 6360 Hills Dr
- 6450 Gilbert Lake Rd
- 5630 S Adams Way
- 750 Trailwood Path Unit B
- 450 Billingsgate Ct Unit C
- 1760 Trailwood Path
- 5825 Lahser Rd
- 3546 Bloomfield Club Dr
- 6560 Red Maple Ln
- 6580 Red Maple Ln
- 3880 Oakland Dr
- 6660 Woodbank Dr
- 5904 Wing Lake Rd
- 4017 Hidden Woods Dr
- 6727 Lahser Rd
- 5129 Woodlands Ln
- 5137 Woodlands Dr Unit 24
- 1287 Charrington Rd
- 6572 Spruce Dr
- 6080 Snowshoe Cir
- 6048 Snowshoe Cir
- 6246 Hills Dr
- 6063 Snowshoe Cir
- 6047 Snowshoe Cir
- 6216 Hills Dr
- 6079 Snowshoe Cir
- 6089 Gilbert Lake Rd
- 6031 Snowshoe Cir
- 6105 Gilbert Lake Rd
- 6077 Gilbert Lake Rd
- 6266 Hills Dr
- 6014 Snowshoe Cir
- 6125 Gilbert Lake Rd
- 3917 Cottontail Ln
- 3929 Cottontail Ln
- 3905 Cottontail Ln
- 5901 Gilbert Lake Rd
- 5990 Orchard Bend Rd
- 6015 Snowshoe Cir