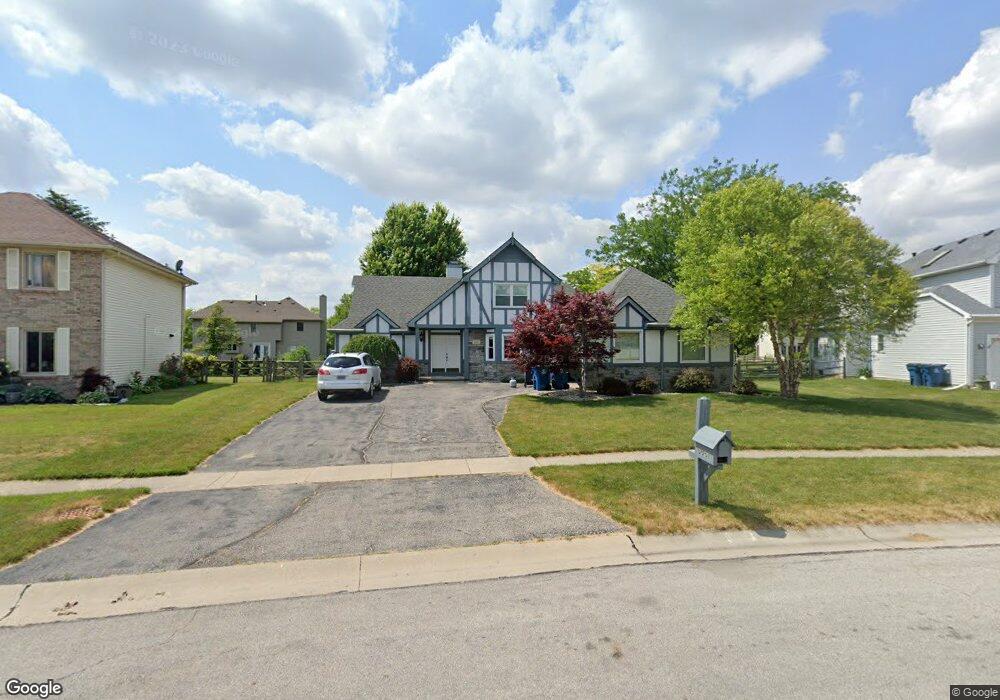
6061 Apple Meadow Dr Sylvania, OH 43560
Estimated Value: $354,000 - $375,000
3
Beds
3
Baths
2,394
Sq Ft
$152/Sq Ft
Est. Value
About This Home
This home is located at 6061 Apple Meadow Dr, Sylvania, OH 43560 and is currently estimated at $364,785, approximately $152 per square foot. 6061 Apple Meadow Dr is a home located in Lucas County with nearby schools including Highland Elementary School, Sylvania McCord Junior High School, and Sylvania Northview High School.
Ownership History
Date
Name
Owned For
Owner Type
Purchase Details
Closed on
May 15, 2009
Sold by
Nelson William J and Nelson Dyane P
Bought by
Luke Keith H
Current Estimated Value
Home Financials for this Owner
Home Financials are based on the most recent Mortgage that was taken out on this home.
Original Mortgage
$185,073
Outstanding Balance
$117,248
Interest Rate
4.9%
Mortgage Type
FHA
Estimated Equity
$247,537
Purchase Details
Closed on
Dec 18, 2007
Sold by
Galambos Joseph J and Galambos Judith L
Bought by
Nelson William J and Nelson Dyane P
Home Financials for this Owner
Home Financials are based on the most recent Mortgage that was taken out on this home.
Original Mortgage
$179,225
Interest Rate
6.31%
Mortgage Type
VA
Purchase Details
Closed on
Mar 9, 1993
Sold by
Culler Rodney R
Purchase Details
Closed on
Jan 4, 1993
Purchase Details
Closed on
May 5, 1989
Create a Home Valuation Report for This Property
The Home Valuation Report is an in-depth analysis detailing your home's value as well as a comparison with similar homes in the area
Home Values in the Area
Average Home Value in this Area
Purchase History
| Date | Buyer | Sale Price | Title Company |
|---|---|---|---|
| Luke Keith H | $178,900 | Louisville Title Agency For | |
| Nelson William J | $173,500 | Louisville Title Agency For | |
| -- | $158,500 | -- | |
| -- | $105,000 | -- | |
| -- | -- | -- |
Source: Public Records
Mortgage History
| Date | Status | Borrower | Loan Amount |
|---|---|---|---|
| Open | Luke Keith H | $185,073 | |
| Previous Owner | Nelson William J | $179,225 |
Source: Public Records
Tax History Compared to Growth
Tax History
| Year | Tax Paid | Tax Assessment Tax Assessment Total Assessment is a certain percentage of the fair market value that is determined by local assessors to be the total taxable value of land and additions on the property. | Land | Improvement |
|---|---|---|---|---|
| 2024 | $3,387 | $107,415 | $18,935 | $88,480 |
| 2023 | $5,667 | $78,085 | $16,275 | $61,810 |
| 2022 | $5,675 | $78,085 | $16,275 | $61,810 |
| 2021 | $5,821 | $78,085 | $16,275 | $61,810 |
| 2020 | $5,565 | $66,290 | $11,620 | $54,670 |
| 2019 | $5,353 | $66,290 | $11,620 | $54,670 |
| 2018 | $2,671 | $66,290 | $11,620 | $54,670 |
| 2017 | $5,709 | $64,750 | $11,340 | $53,410 |
| 2016 | $5,595 | $185,000 | $32,400 | $152,600 |
| 2015 | $5,221 | $183,500 | $32,400 | $151,100 |
| 2014 | $4,884 | $61,780 | $10,920 | $50,860 |
| 2013 | $4,884 | $61,780 | $10,920 | $50,860 |
Source: Public Records
Map
Nearby Homes
- 6025 Hawthorne Dr
- 6129 Burrwood Dr
- 8334 Ledgestone Ave Unit 8334
- 6047 Peppermill Dr
- 8367 Fossil Ave
- 7858 Erie St
- 8362 Sylvania Metamora Rd
- 5666 Fox Hollow Ct
- 5646 Breezy Porch Dr
- 5434 Willow Cir
- 5914 Winding Way Dr
- 6200 Yankee Rd
- 8134 Little Rd
- 8753 N Stone Mill Rd
- 5346 Palisades Dr
- 6053 Gregory Dr
- 5235 Brookfield Ln
- 9011 Bear Creek Dr
- 7120 Grenlock Dr
- 5310 Turnberry Ln
- 6053 Apple Meadow Dr
- 6067 Apple Meadow Dr
- 6104 Deepwood Dr
- 6058 Deepwood Dr
- 6112 Deepwood Dr
- 6047 Apple Meadow Dr
- 8050 Apple Meadow Dr
- 6060 Apple Meadow Dr
- 6050 Deepwood Dr
- 6122 Deepwood Dr
- 6050 Apple Meadow Dr
- 6041 Apple Meadow Dr
- 8047 Apple Meadow Dr
- 6042 Apple Meadow Dr
- 8063 Deepwood Dr
- 8044 Apple Meadow Dr
- 6042 Deepwood Dr
- 6101 Deepwood Dr
- 8053 Deepwood Dr
- 6109 Deepwood Dr