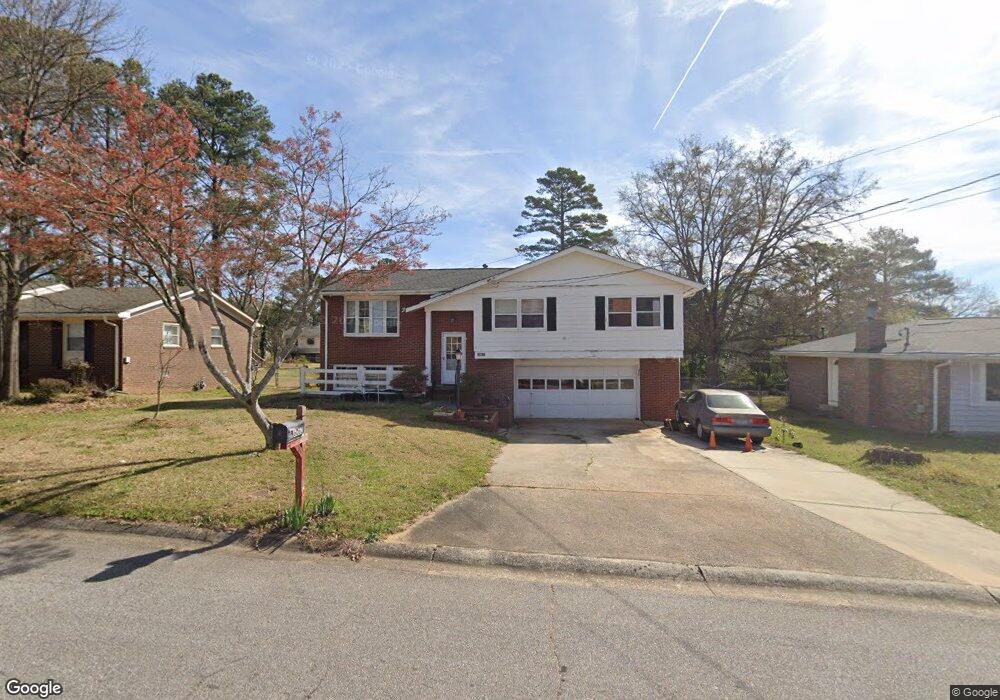
6062 Danbury Ct Morrow, GA 30260
Estimated Value: $218,047 - $278,000
4
Beds
2
Baths
1,990
Sq Ft
$127/Sq Ft
Est. Value
About This Home
This home is located at 6062 Danbury Ct, Morrow, GA 30260 and is currently estimated at $253,512, approximately $127 per square foot. 6062 Danbury Ct is a home located in Clayton County with nearby schools including Thurgood Marshall Elementary School, Morrow Middle School, and Morrow High School.
Ownership History
Date
Name
Owned For
Owner Type
Purchase Details
Closed on
Oct 23, 2018
Sold by
Ho Cuc
Bought by
Nguyen Ngoc Thi and Vu Phuong Dinh
Current Estimated Value
Home Financials for this Owner
Home Financials are based on the most recent Mortgage that was taken out on this home.
Original Mortgage
$108,000
Outstanding Balance
$94,581
Interest Rate
4.7%
Mortgage Type
New Conventional
Estimated Equity
$158,931
Purchase Details
Closed on
Dec 18, 2002
Sold by
Ho Cuc
Bought by
Ho Cuc
Home Financials for this Owner
Home Financials are based on the most recent Mortgage that was taken out on this home.
Original Mortgage
$88,000
Interest Rate
5.99%
Mortgage Type
New Conventional
Purchase Details
Closed on
Mar 1, 2001
Sold by
Ho Cuc T
Bought by
Lai Dat T
Home Financials for this Owner
Home Financials are based on the most recent Mortgage that was taken out on this home.
Original Mortgage
$85,100
Interest Rate
7.02%
Mortgage Type
New Conventional
Create a Home Valuation Report for This Property
The Home Valuation Report is an in-depth analysis detailing your home's value as well as a comparison with similar homes in the area
Home Values in the Area
Average Home Value in this Area
Purchase History
| Date | Buyer | Sale Price | Title Company |
|---|---|---|---|
| Nguyen Ngoc Thi | $135,000 | -- | |
| Ho Cuc | -- | -- | |
| Lai Dat T | -- | -- | |
| Ho Cuc T | $113,500 | -- |
Source: Public Records
Mortgage History
| Date | Status | Borrower | Loan Amount |
|---|---|---|---|
| Open | Nguyen Ngoc Thi | $108,000 | |
| Previous Owner | Ho Cuc | $88,000 | |
| Previous Owner | Ho Cuc T | $85,100 |
Source: Public Records
Tax History Compared to Growth
Tax History
| Year | Tax Paid | Tax Assessment Tax Assessment Total Assessment is a certain percentage of the fair market value that is determined by local assessors to be the total taxable value of land and additions on the property. | Land | Improvement |
|---|---|---|---|---|
| 2024 | $1,677 | $96,400 | $7,200 | $89,200 |
| 2023 | $3,599 | $99,680 | $7,200 | $92,480 |
| 2022 | $1,198 | $72,240 | $7,200 | $65,040 |
| 2021 | $1,046 | $63,640 | $7,200 | $56,440 |
| 2020 | $1,033 | $61,640 | $7,200 | $54,440 |
| 2019 | $1,740 | $52,856 | $4,800 | $48,056 |
| 2018 | $1,182 | $39,117 | $4,800 | $34,317 |
| 2017 | $844 | $30,744 | $4,800 | $25,944 |
| 2016 | $640 | $25,719 | $4,800 | $20,919 |
| 2015 | $642 | $0 | $0 | $0 |
| 2014 | $411 | $20,324 | $6,400 | $13,924 |
Source: Public Records
Map
Nearby Homes
- 6046 Danbury Ct
- 2436 Wood Valley Dr
- 6181 Castlewood Dr
- 6155 Landover Cir Unit 2
- 6010 Fieldcrest Dr
- 6177 Meadowwood Dr
- 6205 Fieldcrest Dr
- 2316 Santa fe St Unit 5
- 2276 Santa fe St Unit 19
- 2272 Santa fe St Unit 21
- The Daisy Plan at Sonata
- The Lily Plan at Sonata
- The Azalea Plan at Sonata
- The Rose Plan at Sonata
- 2455 Lake Harbin Rd
- 5871 Dan Dr
- 2057 Fort Trail
- 0 Thompson Blvd
- 5812 Thompson Blvd
- 5816 Thompson Blvd
- 6070 Danbury Ct
- 6054 Danbury Ct
- 0 Danbury Ct Unit 7446830
- 0 Danbury Ct Unit 8358929
- 0 Danbury Ct Unit 8226608
- 0 Danbury Ct Unit 8184066
- 0 Danbury Ct Unit 7561607
- 0 Danbury Ct Unit 7044011
- 6057 Fairfield Dr Unit 2
- 6065 Fairfield Dr
- 6078 Danbury Ct
- 6049 Fairfield Dr Unit 2
- 6063 Danbury Ct
- 6073 Fairfield Dr
- 6055 Danbury Ct
- 6071 Danbury Ct
- 2391 Prestige Square
- 6038 Danbury Ct
- 6041 Fairfield Dr
- 2364 Prestige Square