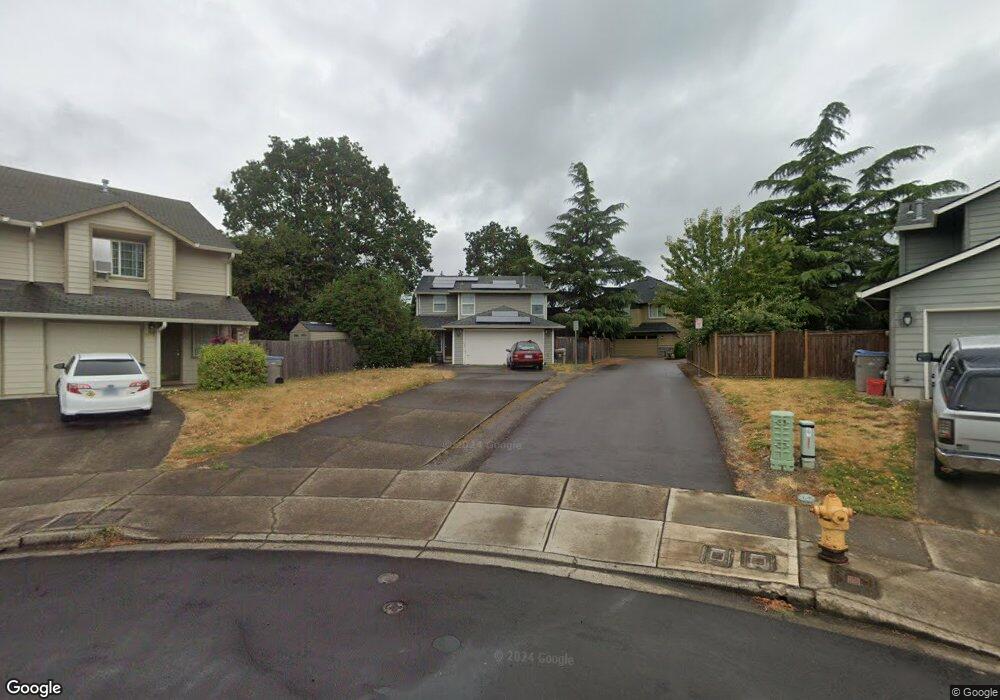
6062 SE Green Ct Hillsboro, OR 97123
Southeast Hillsboro NeighborhoodEstimated Value: $491,000 - $528,000
4
Beds
3
Baths
1,524
Sq Ft
$339/Sq Ft
Est. Value
About This Home
This home is located at 6062 SE Green Ct, Hillsboro, OR 97123 and is currently estimated at $516,970, approximately $339 per square foot. 6062 SE Green Ct is a home located in Washington County with nearby schools including Imlay Elementary School, R.A. Brown Middle School, and Century High School.
Ownership History
Date
Name
Owned For
Owner Type
Purchase Details
Closed on
Nov 30, 2016
Sold by
Jackson Daniel S
Bought by
Conley Hiram J and Conley Laura
Current Estimated Value
Home Financials for this Owner
Home Financials are based on the most recent Mortgage that was taken out on this home.
Original Mortgage
$313,500
Outstanding Balance
$253,146
Interest Rate
3.52%
Mortgage Type
New Conventional
Estimated Equity
$263,824
Purchase Details
Closed on
Apr 26, 2007
Sold by
D E Anderson Inc
Bought by
Jackson Daniel S
Home Financials for this Owner
Home Financials are based on the most recent Mortgage that was taken out on this home.
Original Mortgage
$215,960
Interest Rate
6.11%
Mortgage Type
Unknown
Purchase Details
Closed on
Nov 7, 2000
Sold by
Anderson Daniel E
Bought by
D E Anderson Inc
Home Financials for this Owner
Home Financials are based on the most recent Mortgage that was taken out on this home.
Original Mortgage
$120,000
Interest Rate
7.88%
Create a Home Valuation Report for This Property
The Home Valuation Report is an in-depth analysis detailing your home's value as well as a comparison with similar homes in the area
Home Values in the Area
Average Home Value in this Area
Purchase History
| Date | Buyer | Sale Price | Title Company |
|---|---|---|---|
| Conley Hiram J | $330,000 | Ticor Title | |
| Jackson Daniel S | $269,950 | First American | |
| D E Anderson Inc | -- | Pacific Nw Title | |
| Anderson Daniel E | -- | Pacific Nw Title |
Source: Public Records
Mortgage History
| Date | Status | Borrower | Loan Amount |
|---|---|---|---|
| Open | Conley Hiram J | $313,500 | |
| Previous Owner | Jackson Daniel S | $215,960 | |
| Previous Owner | Anderson Daniel E | $120,000 |
Source: Public Records
Tax History Compared to Growth
Tax History
| Year | Tax Paid | Tax Assessment Tax Assessment Total Assessment is a certain percentage of the fair market value that is determined by local assessors to be the total taxable value of land and additions on the property. | Land | Improvement |
|---|---|---|---|---|
| 2025 | $4,367 | $267,160 | -- | -- |
| 2024 | $4,243 | $259,380 | -- | -- |
| 2023 | $4,243 | $251,830 | $0 | $0 |
| 2022 | $4,128 | $251,830 | $0 | $0 |
| 2021 | $4,045 | $237,380 | $0 | $0 |
| 2020 | $3,958 | $230,470 | $0 | $0 |
| 2019 | $3,844 | $223,760 | $0 | $0 |
| 2018 | $3,680 | $217,250 | $0 | $0 |
| 2017 | $3,546 | $210,930 | $0 | $0 |
| 2016 | $3,449 | $204,790 | $0 | $0 |
| 2015 | $3,310 | $198,830 | $0 | $0 |
| 2014 | $3,291 | $193,040 | $0 | $0 |
Source: Public Records
Map
Nearby Homes
- 1307 SE 61st Place
- 1589 SE 62nd Ave
- 862 SE 63rd Dr
- 830 SE 59th Ave
- 5619 SE Lexington Dr
- 6194 SE Maple St
- 0 SE 59th Ct
- 5744 SE Popes Place
- 5396 SE Frances Ct
- 5728 SE Popes Place
- 1974 SE 60th Ave
- 6417 SE Maple St
- 2004 SE 63rd Ave
- 6461 SE Maple St
- 5640 SE Rancho St
- 1355 SE 68th Ave
- 6641 SE Wrenfield St
- 2170 SE 61st Dr
- 818 SE 68th Place
- 1420 SE 51st Ave
- 6046 SE Green Ct
- 6075 SE Green Ct
- 6066 SE Green Ct
- 6068 SE Green Ct
- 6054 SE Green Ct
- 1131 SE 61st Way
- 1089 SE 60th Ct
- 6093 SE Green Ct
- 6091 SE Green Ct
- 1073 SE 61st Way
- 1305 SE 61st Place
- 1301 SE 61st Place
- 1055 SE 60th Ct
- 6125 SE Green Ct
- 1128 SE 61st Way
- 6147 SE Green Ct
- 1309 SE 61st Place
- 1076 SE 61st Way
- 1017 SE 61st Way
- 1239 SE 62nd Ave