Estimated Value: $520,000 - $689,916
2
Beds
2
Baths
1,868
Sq Ft
$320/Sq Ft
Est. Value
About This Home
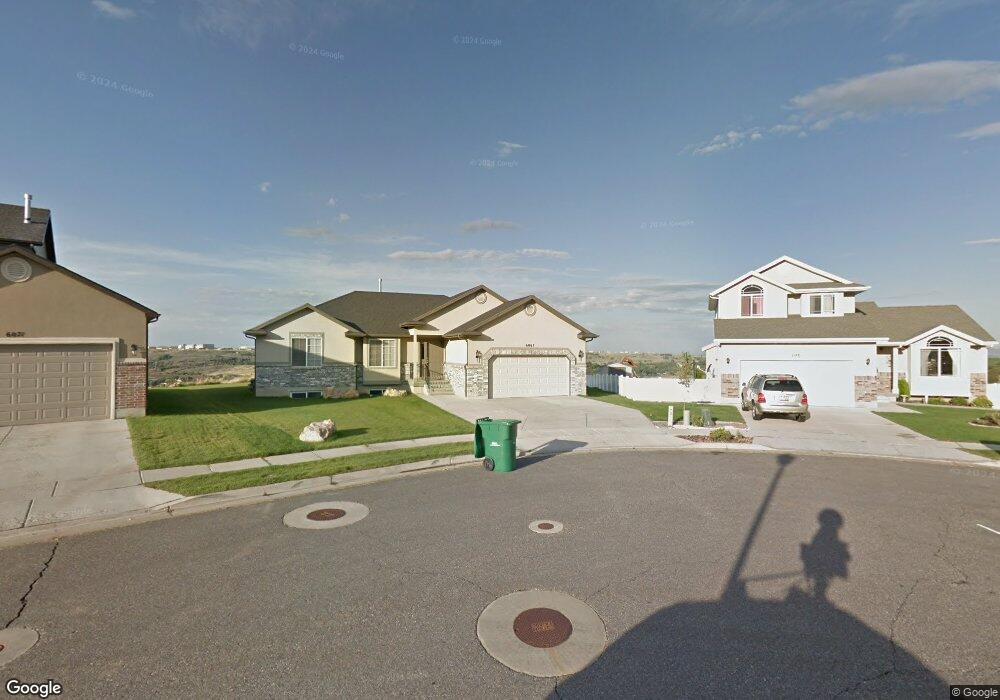
This home is located at 6067 S 1150 E, Ogden, UT 84405 and is currently estimated at $598,479, approximately $320 per square foot. 6067 S 1150 E is a home located in Weber County with nearby schools including H Guy Child School, South Ogden Junior High School, and Bonneville High School.
Ownership History
Date
Name
Owned For
Owner Type
Purchase Details
Closed on
Nov 3, 2021
Sold by
Johnson Kay E
Bought by
Kay E Johnson Revocable Living Trust
Current Estimated Value
Purchase Details
Closed on
Mar 25, 2005
Sold by
Sherwood Homes Llc
Bought by
Johnson Kay E
Home Financials for this Owner
Home Financials are based on the most recent Mortgage that was taken out on this home.
Original Mortgage
$152,000
Interest Rate
5.6%
Mortgage Type
Fannie Mae Freddie Mac
Purchase Details
Closed on
Nov 4, 2004
Sold by
Brier Ridge Llc
Bought by
Sherwood Homes Lc
Create a Home Valuation Report for This Property
The Home Valuation Report is an in-depth analysis detailing your home's value as well as a comparison with similar homes in the area
Home Values in the Area
Average Home Value in this Area
Purchase History
| Date | Buyer | Sale Price | Title Company |
|---|---|---|---|
| Kay E Johnson Revocable Living Trust | -- | None Listed On Document | |
| Johnson Kay E | -- | -- | |
| Sherwood Homes Lc | -- | Security Title |
Source: Public Records
Mortgage History
| Date | Status | Borrower | Loan Amount |
|---|---|---|---|
| Previous Owner | Johnson Kay E | $152,000 |
Source: Public Records
Tax History
| Year | Tax Paid | Tax Assessment Tax Assessment Total Assessment is a certain percentage of the fair market value that is determined by local assessors to be the total taxable value of land and additions on the property. | Land | Improvement |
|---|---|---|---|---|
| 2025 | $4,489 | $648,140 | $200,419 | $447,721 |
| 2024 | $4,265 | $348,149 | $110,230 | $237,919 |
| 2023 | $3,710 | $302,500 | $106,586 | $195,914 |
| 2022 | $3,883 | $326,700 | $79,619 | $247,081 |
| 2021 | $3,282 | $464,000 | $98,266 | $365,734 |
| 2020 | $2,959 | $389,000 | $80,091 | $308,909 |
| 2019 | $2,772 | $350,000 | $75,107 | $274,893 |
| 2018 | $2,858 | $346,000 | $75,107 | $270,893 |
| 2017 | $2,595 | $305,000 | $69,935 | $235,065 |
| 2016 | $2,309 | $153,594 | $35,952 | $117,642 |
| 2015 | $2,332 | $153,594 | $35,952 | $117,642 |
| 2014 | $1,909 | $123,955 | $35,952 | $88,003 |
Source: Public Records
Map
Nearby Homes
Your Personal Tour Guide
Ask me questions while you tour the home.