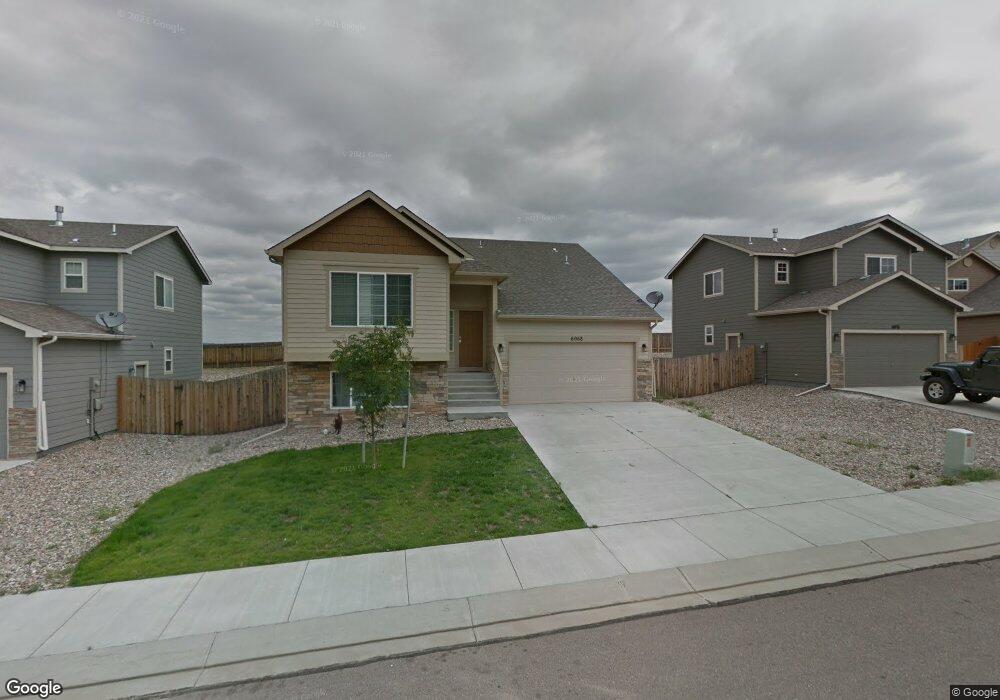
6068 Dancing Sun Way Colorado Springs, CO 80911
Fountain Valley Ranch NeighborhoodEstimated Value: $472,000 - $488,000
4
Beds
4
Baths
2,292
Sq Ft
$209/Sq Ft
Est. Value
About This Home
This home is located at 6068 Dancing Sun Way, Colorado Springs, CO 80911 and is currently estimated at $479,126, approximately $209 per square foot. 6068 Dancing Sun Way is a home located in El Paso County with nearby schools including French Elementary School, Sproul Junior High School, and Widefield High School.
Ownership History
Date
Name
Owned For
Owner Type
Purchase Details
Closed on
Jan 10, 2022
Sold by
Olmos Jose Antonio
Bought by
Yoo Byung Gu and Lee Youn Soo
Current Estimated Value
Home Financials for this Owner
Home Financials are based on the most recent Mortgage that was taken out on this home.
Original Mortgage
$400,000
Outstanding Balance
$368,359
Interest Rate
3.05%
Mortgage Type
New Conventional
Estimated Equity
$110,767
Purchase Details
Closed on
Jun 11, 2015
Sold by
Cheesman Katherine M and Cheesman Cory M
Bought by
Olmos Jose Antonio
Home Financials for this Owner
Home Financials are based on the most recent Mortgage that was taken out on this home.
Original Mortgage
$165,482
Interest Rate
3.82%
Mortgage Type
New Conventional
Purchase Details
Closed on
Dec 17, 2012
Sold by
Journey Homes Cs Llc
Bought by
Cheesman Katherine M and Cheemsman Cory M
Home Financials for this Owner
Home Financials are based on the most recent Mortgage that was taken out on this home.
Original Mortgage
$210,153
Interest Rate
3.42%
Mortgage Type
VA
Create a Home Valuation Report for This Property
The Home Valuation Report is an in-depth analysis detailing your home's value as well as a comparison with similar homes in the area
Home Values in the Area
Average Home Value in this Area
Purchase History
| Date | Buyer | Sale Price | Title Company |
|---|---|---|---|
| Yoo Byung Gu | $505,000 | Heritage Title Company | |
| Yoo Byung Gu | $505,000 | Heritage Title Company | |
| Olmos Jose Antonio | $194,685 | Unified Title Company | |
| Cheesman Katherine M | $205,730 | Heritage Title |
Source: Public Records
Mortgage History
| Date | Status | Borrower | Loan Amount |
|---|---|---|---|
| Open | Yoo Byung Gu | $400,000 | |
| Closed | Yoo Byung Gu | $400,000 | |
| Previous Owner | Olmos Jose Antonio | $165,482 | |
| Previous Owner | Cheesman Katherine M | $210,153 |
Source: Public Records
Tax History Compared to Growth
Tax History
| Year | Tax Paid | Tax Assessment Tax Assessment Total Assessment is a certain percentage of the fair market value that is determined by local assessors to be the total taxable value of land and additions on the property. | Land | Improvement |
|---|---|---|---|---|
| 2025 | $3,145 | $30,120 | -- | -- |
| 2024 | $3,097 | $31,170 | $5,470 | $25,700 |
| 2023 | $3,097 | $31,170 | $5,470 | $25,700 |
| 2022 | $2,607 | $22,740 | $4,050 | $18,690 |
| 2021 | $2,767 | $23,400 | $4,170 | $19,230 |
| 2020 | $2,500 | $20,740 | $3,650 | $17,090 |
| 2019 | $2,491 | $20,740 | $3,650 | $17,090 |
| 2018 | $2,090 | $16,610 | $3,670 | $12,940 |
| 2017 | $2,172 | $16,610 | $3,670 | $12,940 |
| 2016 | $1,819 | $16,380 | $3,820 | $12,560 |
| 2015 | $1,848 | $16,380 | $3,820 | $12,560 |
| 2014 | $1,899 | $16,870 | $2,560 | $14,310 |
Source: Public Records
Map
Nearby Homes
- 6446 Dancing Moon Way
- 5963 Dancing Sun Way
- 4530 Sierra Rica Rd
- 6053 San Mateo Dr
- 6531 Passing Sky Dr
- 4637 Dancing Light Way
- 4651 Dancing Rain Way
- 6425 Dancing Star Way
- 6427 Marilee Way
- 4916 Justeagen Dr
- 6340 Passing Sky Dr
- 4819 Justeagen Dr
- 4945 Gami Way
- 4966 Spokane Way
- 4858 Wolf Moon Dr
- 4959 Gami Way
- 4887 Wolf Moon Dr
- 7000 Passing Sky Dr
- 4953 Escanaba Dr
- 4928 Wolf Moon Dr
- 6060 Dancing Sun Way
- 6076 Dancing Sun Way
- 6052 Dancing Sun Way
- 6084 Dancing Sun Way
- 6059 Dancing Sun Way
- 6044 Dancing Sun Way
- 6051 Dancing Sun Way
- 6434 Dancing Moon Way
- 6457 Dancing Moon Way
- 6043 Dancing Sun Way
- 6445 Dancing Moon Way
- 6036 Dancing Sun Way
- 6035 Dancing Sun Way
- 6433 Dancing Moon Way
- 6422 Dancing Moon Way
- 6046 Santo Domingo Rd
- 6220 Marilee Way
- 6027 Dancing Sun Way
- 4502 Whirling Oak Way
- 6421 Dancing Moon Way