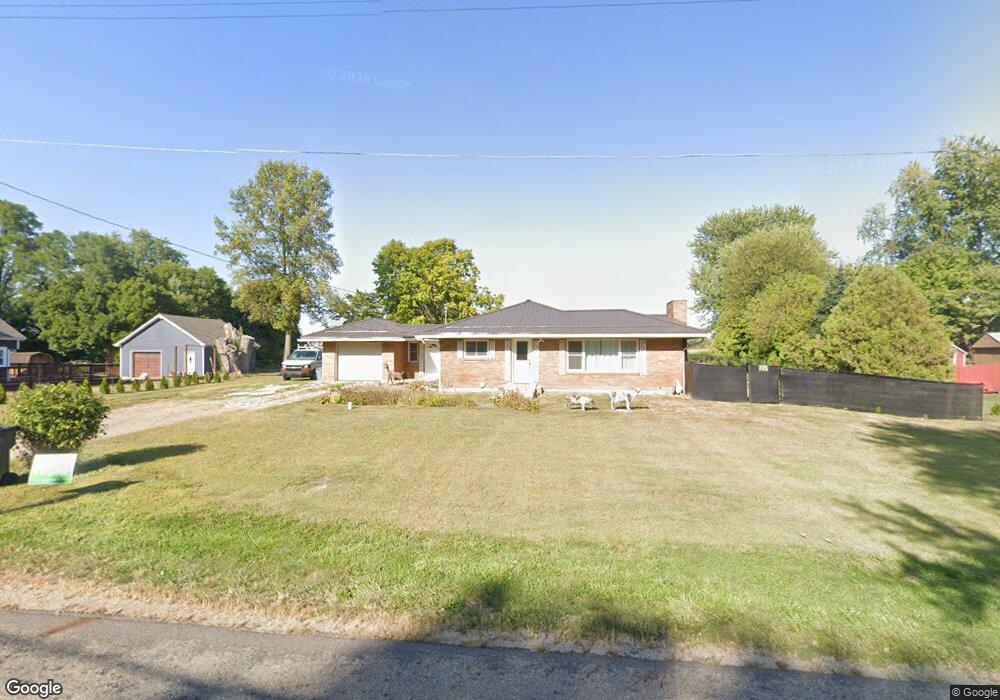
6068 Pickerington Rd Carroll, OH 43112
Estimated Value: $157,000 - $222,000
2
Beds
1
Bath
1,240
Sq Ft
$158/Sq Ft
Est. Value
About This Home
This home is located at 6068 Pickerington Rd, Carroll, OH 43112 and is currently estimated at $195,367, approximately $157 per square foot. 6068 Pickerington Rd is a home with nearby schools including Bloom Carroll Primary School, Bloom Carroll Intermediate School, and Bloom-Carroll Middle School.
Ownership History
Date
Name
Owned For
Owner Type
Purchase Details
Closed on
Mar 20, 2023
Sold by
Benadum Vicki S
Bought by
Layton Christa J
Current Estimated Value
Home Financials for this Owner
Home Financials are based on the most recent Mortgage that was taken out on this home.
Original Mortgage
$150,000
Outstanding Balance
$145,257
Interest Rate
6.09%
Mortgage Type
New Conventional
Estimated Equity
$50,110
Purchase Details
Closed on
Mar 14, 2023
Sold by
Benadum Vicki S
Bought by
Benadum Gary G
Home Financials for this Owner
Home Financials are based on the most recent Mortgage that was taken out on this home.
Original Mortgage
$150,000
Outstanding Balance
$145,257
Interest Rate
6.09%
Mortgage Type
New Conventional
Estimated Equity
$50,110
Purchase Details
Closed on
Feb 11, 1999
Sold by
Trst Karen M Burkhart
Bought by
Benadum Vicki S
Create a Home Valuation Report for This Property
The Home Valuation Report is an in-depth analysis detailing your home's value as well as a comparison with similar homes in the area
Home Values in the Area
Average Home Value in this Area
Purchase History
| Date | Buyer | Sale Price | Title Company |
|---|---|---|---|
| Layton Christa J | $150,000 | None Listed On Document | |
| Benadum Gary G | $150,000 | -- | |
| Benadum Vicki S | $55,000 | -- |
Source: Public Records
Mortgage History
| Date | Status | Borrower | Loan Amount |
|---|---|---|---|
| Open | Layton Christa J | $150,000 | |
| Closed | Benadum Gary G | $150,000 |
Source: Public Records
Tax History Compared to Growth
Tax History
| Year | Tax Paid | Tax Assessment Tax Assessment Total Assessment is a certain percentage of the fair market value that is determined by local assessors to be the total taxable value of land and additions on the property. | Land | Improvement |
|---|---|---|---|---|
| 2024 | $3,710 | $42,380 | $9,700 | $32,680 |
| 2023 | $1,437 | $42,380 | $9,700 | $32,680 |
| 2022 | $1,467 | $42,380 | $9,700 | $32,680 |
| 2021 | $1,620 | $42,380 | $9,700 | $32,680 |
| 2020 | $1,639 | $42,380 | $9,700 | $32,680 |
| 2019 | $1,645 | $42,380 | $9,700 | $32,680 |
| 2018 | $1,196 | $32,400 | $9,240 | $23,160 |
| 2017 | $1,130 | $33,330 | $9,240 | $24,090 |
| 2016 | $1,114 | $33,330 | $9,240 | $24,090 |
| 2015 | $1,063 | $32,210 | $9,240 | $22,970 |
| 2014 | $1,020 | $32,210 | $9,240 | $22,970 |
| 2013 | $1,020 | $32,210 | $9,240 | $22,970 |
Source: Public Records
Map
Nearby Homes
- 7450 Broad St NW
- 4900 Pickerington Rd NW
- 7234 Pickerington Rd
- 7190 Amanda Northern Rd NW
- 8981 Winchester Rd
- 4180 Stone Hill Drive East NW
- 6415 Winchester Rd NW
- 5161 Mason Rd
- 5842 Feldon Ct NW
- 5804 Feldon Ct NW
- 6556 Castlewood Dr NW
- 4400 Kauffman Rd NW
- 9700 Waterloo Eastern Rd
- Grandin Plan at Sycamore Springs - Designer Collection
- Carrington Plan at Sycamore Springs - Designer Collection
- Wyatt Plan at Sycamore Springs - Designer Collection
- Denali Plan at Sycamore Springs - Maple Street Collection
- Magnolia Plan at Sycamore Springs - Designer Collection
- Avery Plan at Sycamore Springs - Designer Collection
- Preston Plan at Sycamore Springs - Maple Street Collection
- 6056 Pickerington Rd
- 6079 Pickerington Rd
- 6088 Pickerington Rd
- 0 Pickerington Rd NW
- 6096 Pickerington Rd NW
- 6096 Pickerington Rd
- 6095 Pickerington Rd
- 6104 Pickerington Rd
- 6103 Pickerington Rd
- 6027 Pickerington Rd
- 6112 Pickerington Rd
- 6128 Pickerington Rd
- 6136 Pickerington Rd
- 6135 Pickerington Rd
- 6144 Pickerington Rd
- 8865 Walnut St NW
- 6152 Pickerington Rd
- 8836 Walnut St NW
- 6160 Pickerington Rd
- 8868 Walnut St NW