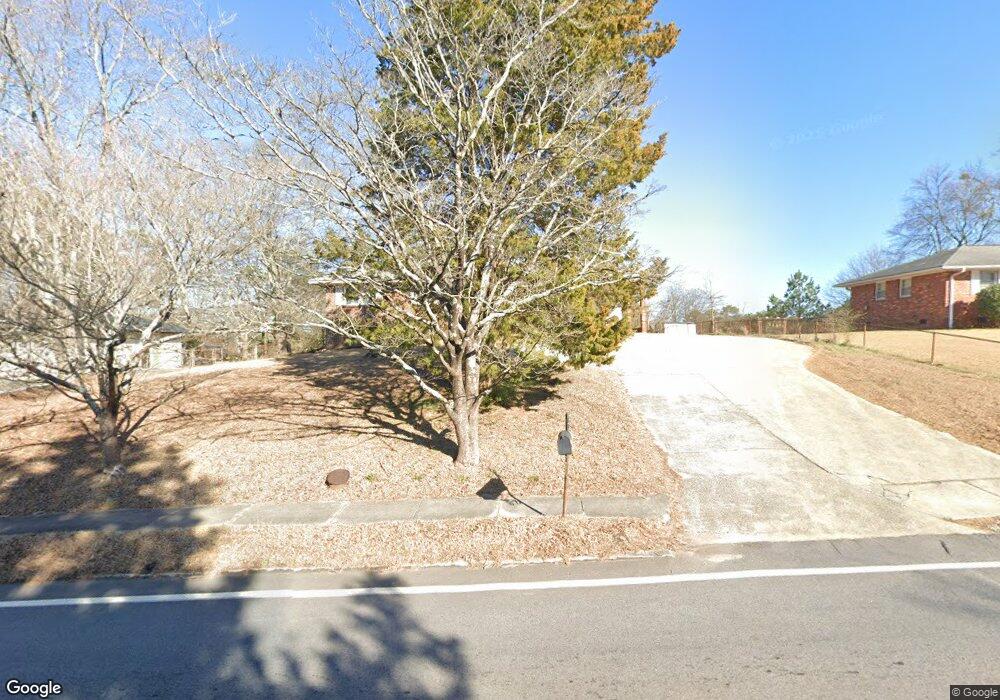
6069 Dodgen Rd SW Mableton, GA 30126
Estimated Value: $201,000 - $235,000
3
Beds
2
Baths
1,075
Sq Ft
$207/Sq Ft
Est. Value
About This Home
This home is located at 6069 Dodgen Rd SW, Mableton, GA 30126 and is currently estimated at $222,915, approximately $207 per square foot. 6069 Dodgen Rd SW is a home located in Cobb County with nearby schools including Clay-Harmony Leland Elementary School, Lindley Middle School, and Pebblebrook High School.
Ownership History
Date
Name
Owned For
Owner Type
Purchase Details
Closed on
Jan 5, 2024
Sold by
Aberle Dioca Cashel
Bought by
Nguyen Randy Anh
Current Estimated Value
Home Financials for this Owner
Home Financials are based on the most recent Mortgage that was taken out on this home.
Original Mortgage
$118,320
Outstanding Balance
$116,276
Interest Rate
7.29%
Mortgage Type
New Conventional
Estimated Equity
$106,639
Purchase Details
Closed on
Jun 23, 2023
Sold by
Simpson Horace Glen
Bought by
Aberle Dionca Cashel
Purchase Details
Closed on
May 15, 2001
Sold by
Simpson Horace G
Bought by
Simpson Horace G and Simpson Iris
Home Financials for this Owner
Home Financials are based on the most recent Mortgage that was taken out on this home.
Original Mortgage
$24,000
Interest Rate
7.11%
Mortgage Type
New Conventional
Create a Home Valuation Report for This Property
The Home Valuation Report is an in-depth analysis detailing your home's value as well as a comparison with similar homes in the area
Home Values in the Area
Average Home Value in this Area
Purchase History
| Date | Buyer | Sale Price | Title Company |
|---|---|---|---|
| Nguyen Randy Anh | $147,900 | None Listed On Document | |
| Aberle Dionca Cashel | $120,000 | None Listed On Document | |
| Simpson Horace G | -- | -- |
Source: Public Records
Mortgage History
| Date | Status | Borrower | Loan Amount |
|---|---|---|---|
| Open | Nguyen Randy Anh | $118,320 | |
| Previous Owner | Simpson Horace G | $24,000 |
Source: Public Records
Tax History Compared to Growth
Tax History
| Year | Tax Paid | Tax Assessment Tax Assessment Total Assessment is a certain percentage of the fair market value that is determined by local assessors to be the total taxable value of land and additions on the property. | Land | Improvement |
|---|---|---|---|---|
| 2025 | $1,446 | $48,000 | $12,240 | $35,760 |
| 2024 | $1,447 | $48,000 | $12,240 | $35,760 |
| 2023 | $141 | $65,288 | $16,000 | $49,288 |
| 2022 | $333 | $62,796 | $10,000 | $52,796 |
| 2021 | $307 | $54,116 | $10,000 | $44,116 |
| 2020 | $261 | $38,528 | $10,000 | $28,528 |
| 2019 | $253 | $36,060 | $10,000 | $26,060 |
| 2018 | $253 | $36,060 | $10,000 | $26,060 |
| 2017 | $172 | $24,320 | $6,000 | $18,320 |
| 2016 | $123 | $19,268 | $4,800 | $14,468 |
| 2015 | $131 | $19,268 | $4,800 | $14,468 |
| 2014 | $88 | $15,056 | $0 | $0 |
Source: Public Records
Map
Nearby Homes
- 6215 Dodgen Rd SW
- 220 Lane Dr
- 6264 Godfrey Dr SW
- 317 Community Dr SW
- 6030 Ridge Dr SE
- 6286 Allen Rd SW
- 6361 Dodgen Rd SW
- 5859 Lone Oak Dr SW
- 5972 Allen Rd SE
- 000 Arbor Gate Dr SW
- 496 Elizabeth Ln SW
- 6529 Arbor Gate Dr SW Unit 12
- 6531 Arbor Gate Dr SW Unit 12
- 6554 Arbor Gate Dr SW Unit 4
- 6365 Susan Dr SW
- KNOLLWOOD Plan at Mableton Station - Townhomes
- 6243 Honeybell Aly
- 6500 Dodgen Rd SW
- 537 Elizabeth Ln SW
- 6305 Mountain Home Way SE
- 6057 Dodgen Rd SW
- 6079 Dodgen Rd SW
- 6089 Dodgen Rd SW
- 6042 Wedgewood Dr SE
- 6045 Dodgen Rd SW
- 6038 Wedgewood Dr SE
- 6046 Wedgewood Dr SE
- 6064 Dodgen Rd SW
- 6042 Wedgewood Dr SW
- 6074 Dodgen Rd SW
- 6050 Wedgewood Dr SE
- 6107 Dodgen Rd SW
- 6046 Dodgen Rd SW
- 6033 Dodgen Rd SW
- 6084 Dodgen Rd SW
- 6034 Wedgewood Dr SE
- 6034 Wedgewood Dr SE Unit 31
- 6094 Dodgen Rd SW
- 6054 Wedgewood Dr SE
- 6036 Dodgen Rd SW