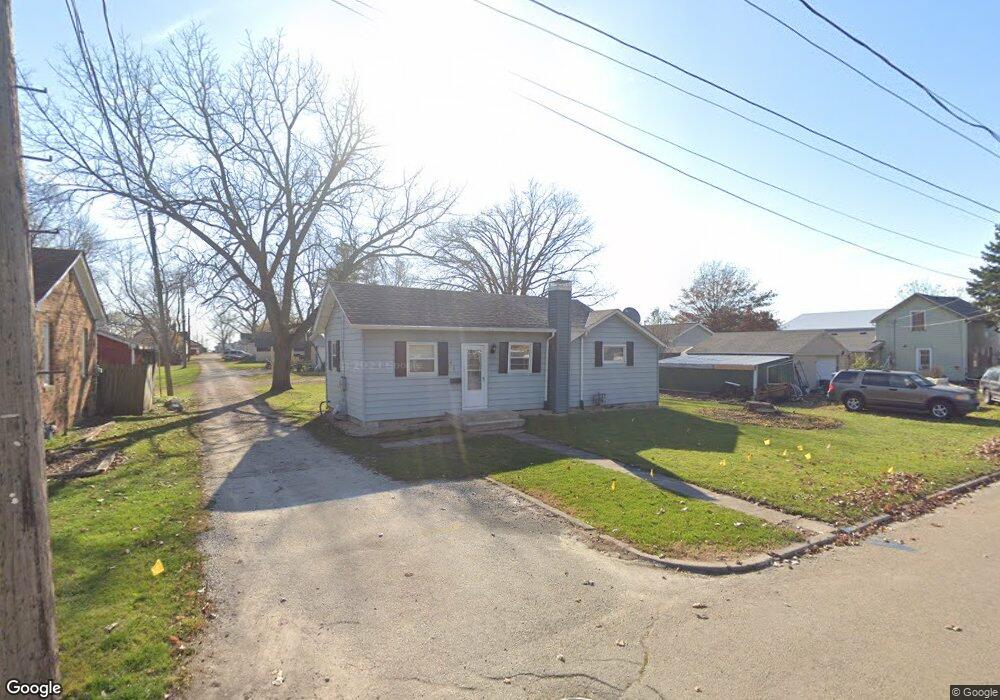
607 2nd St Mendota, IL 61342
Estimated Value: $93,803 - $142,000
2
Beds
1
Bath
780
Sq Ft
$141/Sq Ft
Est. Value
About This Home
This home is located at 607 2nd St, Mendota, IL 61342 and is currently estimated at $109,951, approximately $140 per square foot. 607 2nd St is a home located in LaSalle County with nearby schools including Northbrook School, Lincoln Elementary School, and Blackstone Elementary School.
Ownership History
Date
Name
Owned For
Owner Type
Purchase Details
Closed on
Jan 8, 2024
Sold by
Flores Jose Luis Ramirez and Arteaga Rita
Bought by
Orozco Jaime
Current Estimated Value
Purchase Details
Closed on
Nov 15, 2022
Sold by
Henry Kevin and Agrubright Thomas
Bought by
Arteaga Rita and Flores Jose Luis
Home Financials for this Owner
Home Financials are based on the most recent Mortgage that was taken out on this home.
Original Mortgage
$195,000
Interest Rate
6.75%
Mortgage Type
New Conventional
Purchase Details
Closed on
Nov 22, 2006
Sold by
Knoblauch Bonnie
Bought by
Arteaga Rita Y
Home Financials for this Owner
Home Financials are based on the most recent Mortgage that was taken out on this home.
Original Mortgage
$65,550
Interest Rate
6.41%
Mortgage Type
New Conventional
Purchase Details
Closed on
Jan 1, 2006
Sold by
Johnson Douglas J
Bought by
Denyes Family Trust
Create a Home Valuation Report for This Property
The Home Valuation Report is an in-depth analysis detailing your home's value as well as a comparison with similar homes in the area
Home Values in the Area
Average Home Value in this Area
Purchase History
| Date | Buyer | Sale Price | Title Company |
|---|---|---|---|
| Orozco Jaime | $64,000 | None Available | |
| Arteaga Rita | $110,000 | None Available | |
| Arteaga Rita Y | $69,000 | None Available | |
| Denyes Family Trust | $15,500 | None Available |
Source: Public Records
Mortgage History
| Date | Status | Borrower | Loan Amount |
|---|---|---|---|
| Previous Owner | Arteaga Rita | $195,000 | |
| Previous Owner | Arteaga Rita Y | $65,550 |
Source: Public Records
Tax History Compared to Growth
Tax History
| Year | Tax Paid | Tax Assessment Tax Assessment Total Assessment is a certain percentage of the fair market value that is determined by local assessors to be the total taxable value of land and additions on the property. | Land | Improvement |
|---|---|---|---|---|
| 2024 | $2,306 | $32,624 | $4,399 | $28,225 |
| 2023 | $2,173 | $30,382 | $4,097 | $26,285 |
| 2022 | $1,962 | $27,698 | $3,735 | $23,963 |
| 2021 | $1,923 | $26,220 | $3,536 | $22,684 |
| 2020 | $1,778 | $24,757 | $3,339 | $21,418 |
| 2019 | $1,803 | $24,757 | $3,339 | $21,418 |
| 2018 | $1,796 | $24,215 | $3,266 | $20,949 |
| 2017 | $1,812 | $23,909 | $3,225 | $20,684 |
| 2016 | $1,699 | $22,891 | $3,088 | $19,803 |
| 2015 | $1,637 | $22,196 | $2,994 | $19,202 |
| 2012 | -- | $25,146 | $3,429 | $21,717 |
Source: Public Records
Map
Nearby Homes