
Seller's Agent in 2023
Jackie Dixon
1 Key Realty LLC
(229) 344-5966
138 Total Sales


Estimated Value: $137,000 - $150,000
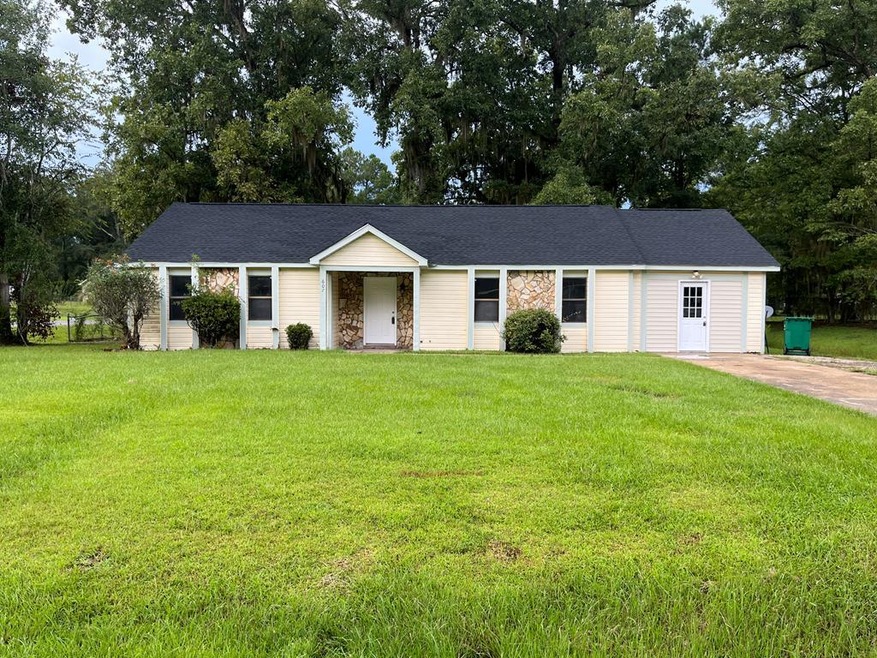
Wonderful NW Investment or your new home! NEW roof! New interior paint, new vinyl plank flooring and new carpet in 2 bedrooms, new ceiling fans , new dishwasher, new vent hood. Floor plan features a tile floor foyer, open Living room - dining room, den looks over the breakfast area of the kitchen. 3 Bedrooms - master has private shower and toilet room, closet off the dressing room of the bathroom. 2 Aditional bedrooms down the hallway. 2nd bath off hallway has a tub/shower unit. Finished in garage makes your 2nd den/ huge master bedroom with laundry closet in the back. Fenced back yard on a corner lot. Road just repaved. Ready for a new owner! Call your Realtor to see it today! Back on the marktet! Buyer's financing fell through - not a property issue. Your opportunity!
Last Agent to Sell the Property
1 Key Realty LLC Brokerage Phone: 2298836155 License #163499 Listed on: 02/17/2023
Last Buyer's Agent
Edith Gordon
The Real Estate Concierge LLC License #427943
| Date | Buyer | Sale Price | Title Company |
|---|---|---|---|
| Hartley Matthew P | $141,000 | -- | |
| Jana Properties Llc | $90,000 | -- | |
| Bush-Bacon Developers | $72,000 | -- | |
| Wright Rodney | $66,100 | -- | |
| Anderson Joseph Etal | $46,500 | -- |
| Date | Status | Borrower | Loan Amount |
|---|---|---|---|
| Open | Hartley Matthew P | $138,446 |
| Date | Event | Price | List to Sale | Price per Sq Ft |
|---|---|---|---|---|
| 03/30/2023 03/30/23 | Sold | $141,000 | -- | $86 / Sq Ft |
| 02/17/2023 02/17/23 | Pending | -- | -- | -- |
| Year | Tax Paid | Tax Assessment Tax Assessment Total Assessment is a certain percentage of the fair market value that is determined by local assessors to be the total taxable value of land and additions on the property. | Land | Improvement |
|---|---|---|---|---|
| 2025 | $1,440 | $28,440 | $3,600 | $24,840 |
| 2024 | $1,440 | $28,440 | $3,600 | $24,840 |
| 2023 | $1,325 | $28,440 | $3,600 | $24,840 |
| 2022 | $1,330 | $28,440 | $3,600 | $24,840 |
| 2021 | $1,233 | $28,440 | $3,600 | $24,840 |
| 2020 | $641 | $28,440 | $3,600 | $24,840 |
| 2019 | $1,241 | $28,440 | $3,600 | $24,840 |
| 2018 | $1,246 | $28,440 | $3,600 | $24,840 |
| 2017 | $1,161 | $28,440 | $3,600 | $24,840 |
| 2016 | $1,161 | $28,440 | $3,600 | $24,840 |
| 2015 | $1,164 | $28,440 | $3,600 | $24,840 |
| 2014 | $1,150 | $28,440 | $3,600 | $24,840 |
Seller's Agent in 2023
Jackie Dixon
1 Key Realty LLC
(229) 344-5966
138 Total Sales
E
Buyer's Agent in 2023
Edith Gordon
The Real Estate Concierge LLC
Source: Albany Board of REALTORS®
MLS Number: 151008
APN: 00365-00006-090
Ask me questions while you tour the home.