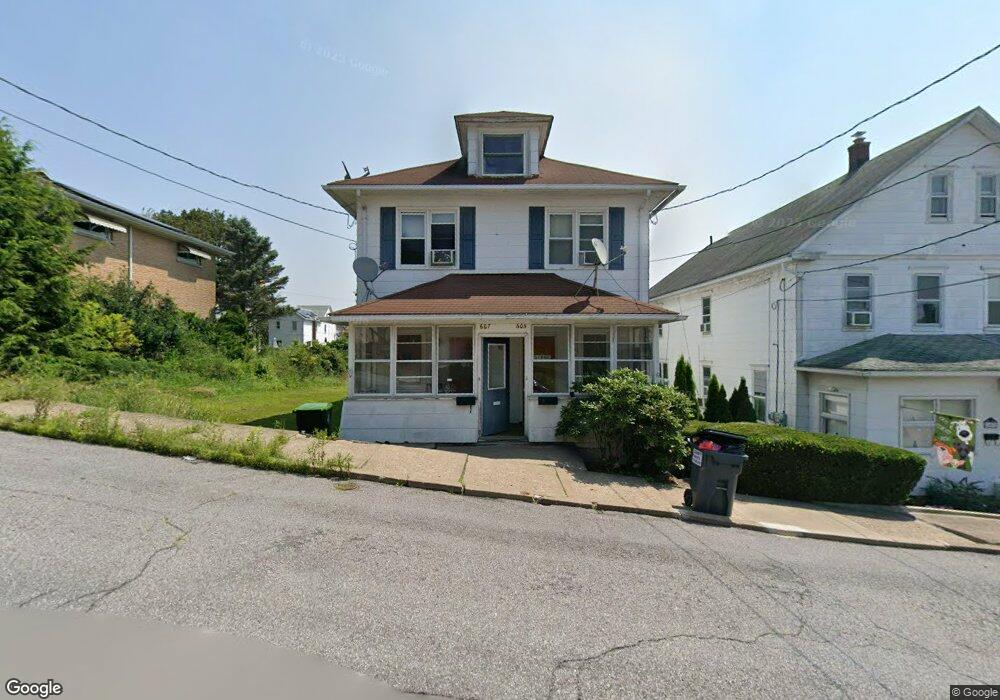
607 Cedar St Freeland, PA 18224
Estimated Value: $108,856 - $141,000
--
Bed
--
Bath
1,056
Sq Ft
$120/Sq Ft
Est. Value
About This Home
This home is located at 607 Cedar St, Freeland, PA 18224 and is currently estimated at $126,964, approximately $120 per square foot. 607 Cedar St is a home located in Luzerne County with nearby schools including Hazleton Area High School and Mmi Preparatory School.
Ownership History
Date
Name
Owned For
Owner Type
Purchase Details
Closed on
Feb 7, 2018
Sold by
Dancho Jon M
Bought by
Dream View Management Group Llc
Current Estimated Value
Purchase Details
Closed on
Sep 28, 2006
Sold by
Amentler Rocco T and Amentler Rosemarie T
Bought by
Amentler Rocco T and Amentler Rosemarie T
Home Financials for this Owner
Home Financials are based on the most recent Mortgage that was taken out on this home.
Original Mortgage
$82,540
Interest Rate
6.47%
Mortgage Type
New Conventional
Create a Home Valuation Report for This Property
The Home Valuation Report is an in-depth analysis detailing your home's value as well as a comparison with similar homes in the area
Home Values in the Area
Average Home Value in this Area
Purchase History
| Date | Buyer | Sale Price | Title Company |
|---|---|---|---|
| Dream View Management Group Llc | $56,877 | Toma Abstract Inc | |
| Amentler Rocco T | -- | None Available |
Source: Public Records
Mortgage History
| Date | Status | Borrower | Loan Amount |
|---|---|---|---|
| Previous Owner | Amentler Rocco T | $82,540 |
Source: Public Records
Tax History Compared to Growth
Tax History
| Year | Tax Paid | Tax Assessment Tax Assessment Total Assessment is a certain percentage of the fair market value that is determined by local assessors to be the total taxable value of land and additions on the property. | Land | Improvement |
|---|---|---|---|---|
| 2025 | $999 | $48,500 | $21,700 | $26,800 |
| 2024 | $958 | $48,500 | $21,700 | $26,800 |
| 2023 | $940 | $48,500 | $21,700 | $26,800 |
| 2022 | $931 | $48,500 | $21,700 | $26,800 |
| 2021 | $903 | $48,500 | $21,700 | $26,800 |
| 2020 | $868 | $48,500 | $21,700 | $26,800 |
| 2019 | $831 | $48,500 | $21,700 | $26,800 |
| 2018 | $799 | $48,500 | $21,700 | $26,800 |
| 2017 | $782 | $48,500 | $21,700 | $26,800 |
| 2016 | -- | $48,500 | $21,700 | $26,800 |
| 2015 | -- | $48,500 | $21,700 | $26,800 |
| 2014 | -- | $48,500 | $21,700 | $26,800 |
Source: Public Records
Map
Nearby Homes