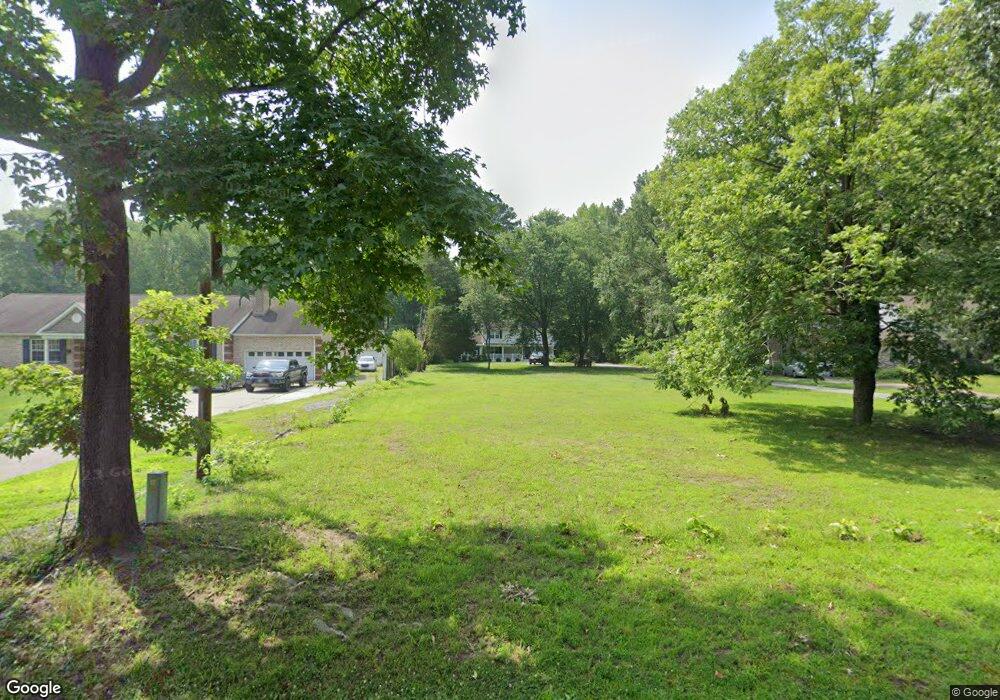
607 Cheadle Loop Rd Seaford, VA 23696
Seaford NeighborhoodEstimated Value: $447,747 - $479,000
3
Beds
3
Baths
2,014
Sq Ft
$232/Sq Ft
Est. Value
About This Home
This home is located at 607 Cheadle Loop Rd, Seaford, VA 23696 and is currently estimated at $466,687, approximately $231 per square foot. 607 Cheadle Loop Rd is a home located in York County with nearby schools including Seaford Elementary School, Yorktown Middle School, and York High School.
Ownership History
Date
Name
Owned For
Owner Type
Purchase Details
Closed on
Aug 3, 2020
Sold by
Acevedo David J
Bought by
Wenninger Jessica N
Current Estimated Value
Home Financials for this Owner
Home Financials are based on the most recent Mortgage that was taken out on this home.
Original Mortgage
$346,285
Outstanding Balance
$308,558
Interest Rate
3%
Mortgage Type
VA
Estimated Equity
$143,499
Purchase Details
Closed on
Dec 22, 2015
Sold by
Brooks Charles E and Cs Brooks Enterprises Llc A Vi
Bought by
Acevedo David J
Home Financials for this Owner
Home Financials are based on the most recent Mortgage that was taken out on this home.
Original Mortgage
$284,900
Interest Rate
3.98%
Mortgage Type
VA
Purchase Details
Closed on
Mar 30, 2015
Sold by
Federal National Mortgage Association
Bought by
Brooks Charles E
Create a Home Valuation Report for This Property
The Home Valuation Report is an in-depth analysis detailing your home's value as well as a comparison with similar homes in the area
Home Values in the Area
Average Home Value in this Area
Purchase History
| Date | Buyer | Sale Price | Title Company |
|---|---|---|---|
| Wenninger Jessica N | $338,500 | Peninsula Title Company | |
| Acevedo David J | $284,900 | Peninsula Title Co | |
| Brooks Charles E | $105,000 | -- |
Source: Public Records
Mortgage History
| Date | Status | Borrower | Loan Amount |
|---|---|---|---|
| Open | Wenninger Jessica N | $346,285 | |
| Previous Owner | Acevedo David J | $284,900 |
Source: Public Records
Tax History Compared to Growth
Tax History
| Year | Tax Paid | Tax Assessment Tax Assessment Total Assessment is a certain percentage of the fair market value that is determined by local assessors to be the total taxable value of land and additions on the property. | Land | Improvement |
|---|---|---|---|---|
| 2025 | $2,833 | $382,800 | $137,500 | $245,300 |
| 2024 | $2,833 | $382,800 | $137,500 | $245,300 |
| 2023 | $2,599 | $337,500 | $110,300 | $227,200 |
| 2022 | $2,633 | $337,500 | $110,300 | $227,200 |
| 2021 | $2,290 | $288,100 | $105,000 | $183,100 |
| 2020 | $2,290 | $288,100 | $105,000 | $183,100 |
| 2019 | $3,284 | $288,100 | $105,000 | $183,100 |
| 2018 | $3,284 | $288,100 | $105,000 | $183,100 |
| 2017 | $2,112 | $281,100 | $105,000 | $176,100 |
| 2016 | $2,112 | $281,100 | $105,000 | $176,100 |
| 2015 | -- | $259,900 | $105,000 | $154,900 |
| 2014 | -- | $271,000 | $105,000 | $166,000 |
Source: Public Records
Map
Nearby Homes
- 1404 Seaford Rd
- 201 Walters Ln
- 117 Woods Rd
- 113 Sunset Dr
- 305 Ludlow Dr
- 300 Ludlow Dr
- 108 Osborn Ln
- 3601 Seaford Rd
- 102 Purgold Rd
- 101 Osborn Ln
- 125 Winsome Haven Dr
- 203 Water Fowl Dr
- 116 Water Fowl Dr
- 102 Willow Leaf Dr
- 103 Tarpon Dr
- 102 Carolyn Crescent
- 200 Hansford Ln
- 315 Dare Rd
- 4001 Seaford Rd
- 315 Dandy Loop Rd
- 319 Sharon Dr
- 317 Sharon Dr
- 605 Cheadle Loop Rd
- 609 Cheadle Loop Rd
- 321 Sharon Dr
- 315 Sharon Dr
- 503 Cheadle Loop Rd
- 505 Cheadle Loop Rd
- 323 Sharon Dr
- 611 Cheadle Loop Rd
- 313 Sharon Dr
- 601 Cheadle Loop Rd
- 318 Sharon Dr
- 316 Sharon Dr
- 320 Sharon Dr
- 314 Sharon Dr
- 311 Sharon Dr
- 101 Goose Creek Rd
- 322 Sharon Dr
- 312 Sharon Dr