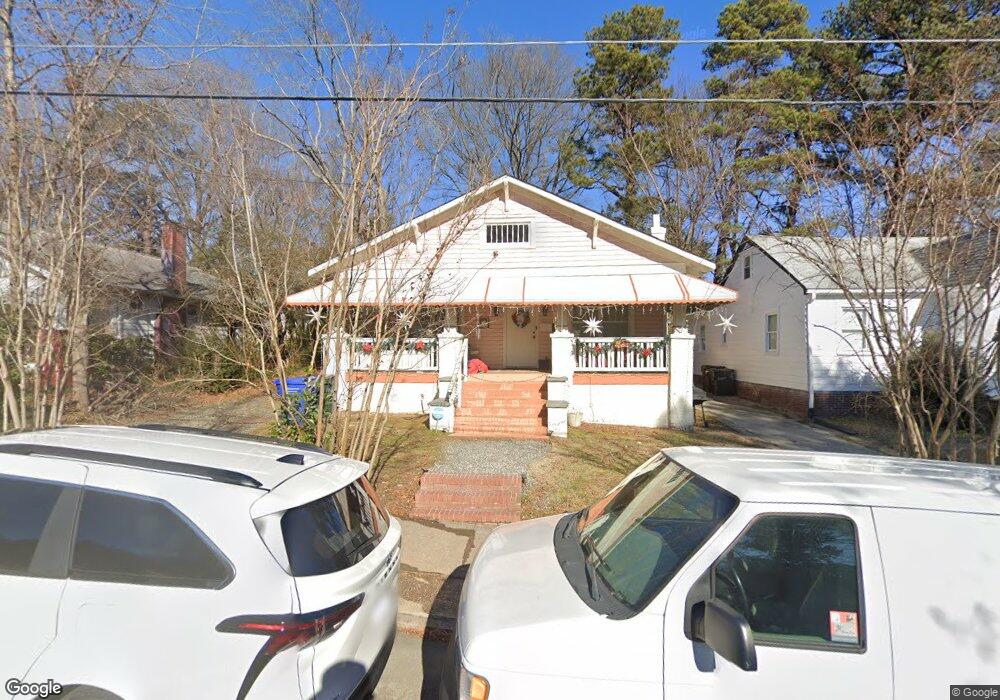
607 Dunbar St Unit A Durham, NC 27701
Hayti District NeighborhoodEstimated Value: $303,000 - $368,000
3
Beds
2
Baths
1,588
Sq Ft
$206/Sq Ft
Est. Value
About This Home
This home is located at 607 Dunbar St Unit A, Durham, NC 27701 and is currently estimated at $326,540, approximately $205 per square foot. 607 Dunbar St Unit A is a home located in Durham County with nearby schools including Canistota Elementary School, Fayetteville Street Elementary School, and James E. Shepard Middle School.
Ownership History
Date
Name
Owned For
Owner Type
Purchase Details
Closed on
Nov 16, 2018
Sold by
Mcqueen George Anthony and Mcqueen Rukayah
Bought by
Maze Hill Llc
Current Estimated Value
Purchase Details
Closed on
Oct 31, 2018
Sold by
Corrine Mabry Estate
Bought by
Leafgate Propeties Llc
Purchase Details
Closed on
Jul 5, 2018
Sold by
Mcqueen George Anthony
Bought by
Mcqueen George Anthony
Create a Home Valuation Report for This Property
The Home Valuation Report is an in-depth analysis detailing your home's value as well as a comparison with similar homes in the area
Home Values in the Area
Average Home Value in this Area
Purchase History
| Date | Buyer | Sale Price | Title Company |
|---|---|---|---|
| Maze Hill Llc | $50,000 | None Available | |
| Leafgate Propeties Llc | -- | None Available | |
| Mcqueen George Anthony | -- | None Available |
Source: Public Records
Tax History Compared to Growth
Tax History
| Year | Tax Paid | Tax Assessment Tax Assessment Total Assessment is a certain percentage of the fair market value that is determined by local assessors to be the total taxable value of land and additions on the property. | Land | Improvement |
|---|---|---|---|---|
| 2025 | $2,733 | $275,666 | $99,750 | $175,916 |
| 2024 | $1,933 | $138,571 | $22,800 | $115,771 |
| 2023 | $1,815 | $138,571 | $22,800 | $115,771 |
| 2022 | $1,774 | $138,571 | $22,800 | $115,771 |
| 2021 | $1,765 | $138,571 | $22,800 | $115,771 |
| 2020 | $1,724 | $73,450 | $22,800 | $50,650 |
| 2019 | $578 | $46,437 | $22,800 | $23,637 |
| 2018 | $853 | $62,852 | $11,400 | $51,452 |
| 2017 | $846 | $62,852 | $11,400 | $51,452 |
| 2016 | $818 | $62,852 | $11,400 | $51,452 |
| 2015 | $1,019 | $73,600 | $16,036 | $57,564 |
| 2014 | $1,019 | $73,600 | $16,036 | $57,564 |
Source: Public Records
Map
Nearby Homes