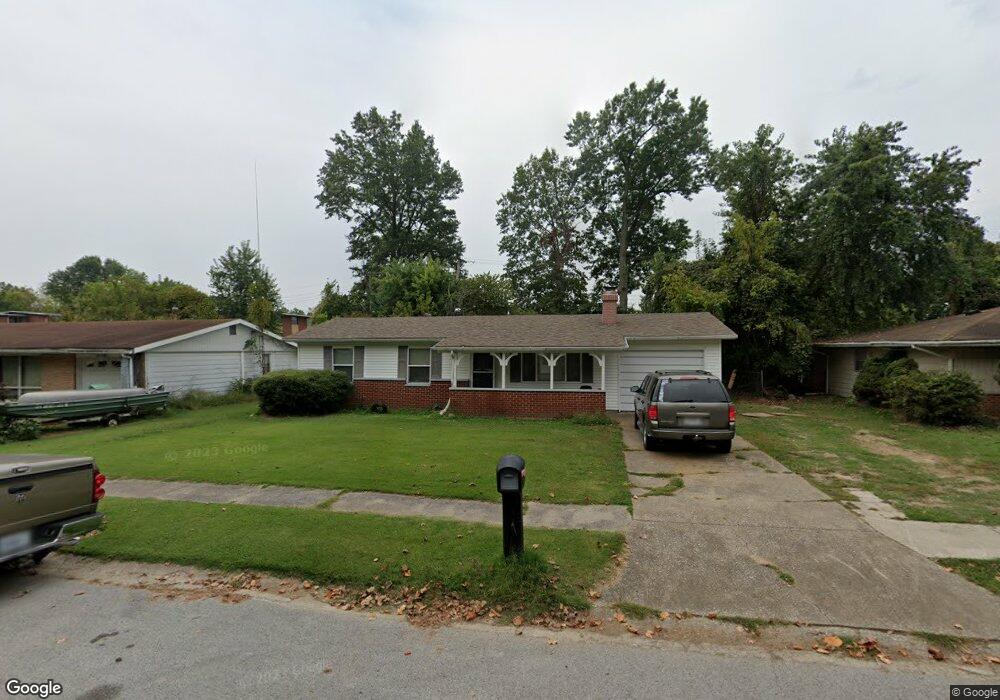
607 E Cindy St Unit 5/6 Carbondale, IL 62901
Estimated Value: $70,000 - $91,000
3
Beds
1
Bath
1,100
Sq Ft
$73/Sq Ft
Est. Value
About This Home
This home is located at 607 E Cindy St Unit 5/6, Carbondale, IL 62901 and is currently estimated at $79,810, approximately $72 per square foot. 607 E Cindy St Unit 5/6 is a home located in Jackson County with nearby schools including Parrish Elementary School, Thomas Elementary School, and Lewis School.
Ownership History
Date
Name
Owned For
Owner Type
Purchase Details
Closed on
Nov 21, 2019
Sold by
Tarrants Patrcik D
Bought by
Ivy Rodger P
Current Estimated Value
Home Financials for this Owner
Home Financials are based on the most recent Mortgage that was taken out on this home.
Original Mortgage
$53,450
Interest Rate
3%
Mortgage Type
VA
Purchase Details
Closed on
Oct 14, 2015
Sold by
Mehrle Derek W
Bought by
Tarrants Patrick D
Home Financials for this Owner
Home Financials are based on the most recent Mortgage that was taken out on this home.
Original Mortgage
$52,250
Interest Rate
3.91%
Mortgage Type
New Conventional
Purchase Details
Closed on
Mar 15, 2007
Sold by
Mehrle Pamela Joy
Bought by
Mehrle Derek W
Purchase Details
Closed on
Jan 19, 2001
Bought by
Mehrle Derek W
Create a Home Valuation Report for This Property
The Home Valuation Report is an in-depth analysis detailing your home's value as well as a comparison with similar homes in the area
Home Values in the Area
Average Home Value in this Area
Purchase History
| Date | Buyer | Sale Price | Title Company |
|---|---|---|---|
| Ivy Rodger P | $53,500 | None Available | |
| Tarrants Patrick D | $55,000 | Attorney | |
| Mehrle Derek W | -- | None Available | |
| Mehrle Derek W | $53,000 | -- |
Source: Public Records
Mortgage History
| Date | Status | Borrower | Loan Amount |
|---|---|---|---|
| Previous Owner | Ivy Rodger P | $53,450 | |
| Previous Owner | Tarrants Patrick D | $52,250 |
Source: Public Records
Tax History Compared to Growth
Tax History
| Year | Tax Paid | Tax Assessment Tax Assessment Total Assessment is a certain percentage of the fair market value that is determined by local assessors to be the total taxable value of land and additions on the property. | Land | Improvement |
|---|---|---|---|---|
| 2024 | $1,872 | $22,425 | $3,576 | $18,849 |
| 2023 | $1,692 | $20,312 | $3,239 | $17,073 |
| 2022 | $1,592 | $18,752 | $2,990 | $15,762 |
| 2021 | $1,530 | $17,841 | $2,845 | $14,996 |
| 2020 | $1,483 | $18,156 | $2,895 | $15,261 |
| 2019 | $1,426 | $18,231 | $2,907 | $15,324 |
| 2018 | $1,401 | $19,024 | $3,033 | $15,991 |
| 2017 | $1,431 | $19,350 | $3,033 | $16,317 |
| 2016 | $1,398 | $19,350 | $3,033 | $16,317 |
| 2015 | -- | $22,268 | $3,033 | $19,235 |
| 2014 | -- | $22,268 | $3,033 | $19,235 |
| 2012 | -- | $29,473 | $3,086 | $26,387 |
Source: Public Records
Map
Nearby Homes
- 418 & 420 S Graham St
- 316 Lynda Dr
- 319 E College St
- 405 E Mill St Unit 14
- 615 S Logan Ave
- 304 E College St
- 300 E College St
- 402 E Hester St Unit 14
- 314 E Hester St
- 305 & 307 E Mill St
- 416 S Washington St Unit 416 1/2
- 408 S University Ave
- 406 S University Ave
- 306 W Cherry St
- 000 Canadian Ln
- 0000 N Westridge Dr
- 410 S Ash St
- 310 W Walnut St
- 403 W Cherry St
- 310 W Monroe St Unit 4
- 607 E Cindy St
- 605 E Cindy St
- 609 E Cindy St
- 603 E Cindy St
- 606 E Cindy St
- 608 E Cindy St
- 604 E Cindy St
- 602 E Cindy St
- 613 E Cindy St
- 406 S Walker St
- 411 S Wall St
- 601 E Cindy St
- 402 S Walker St
- 600 E Cindy St
- 607 E Snider St
- 605 E Snider St
- 405 S Wall 14 Unit 14
- 603 E Snider St
- 609 E Snider St
- 400 S Wall St