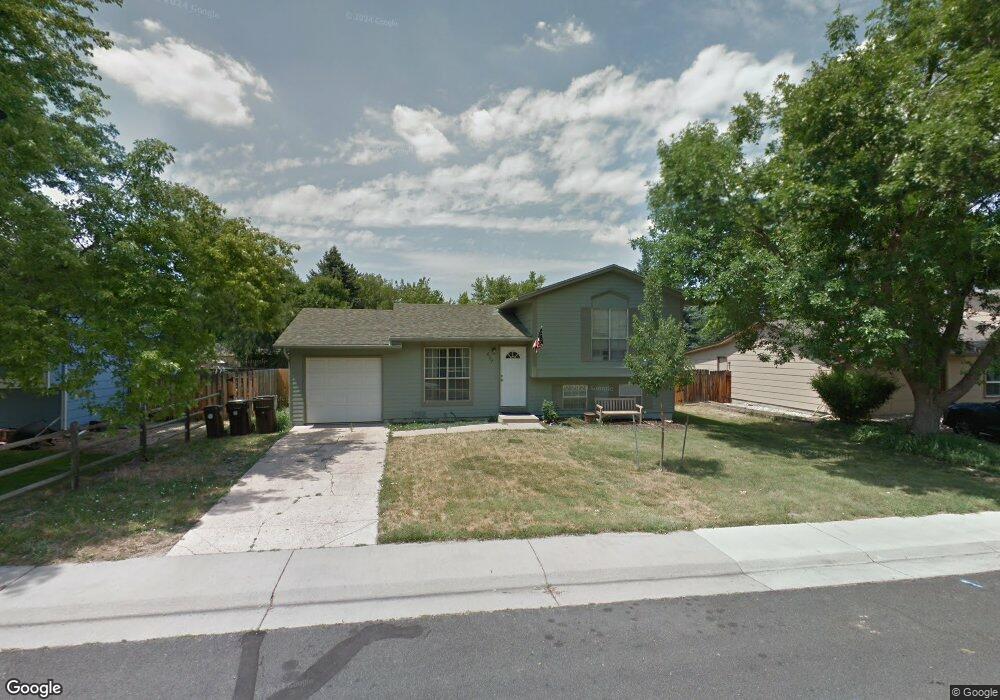
607 Fireside St Louisville, CO 80027
Estimated Value: $611,043 - $737,000
2
Beds
2
Baths
828
Sq Ft
$813/Sq Ft
Est. Value
About This Home
This home is located at 607 Fireside St, Louisville, CO 80027 and is currently estimated at $673,011, approximately $812 per square foot. 607 Fireside St is a home located in Boulder County with nearby schools including Coal Creek Elementary School, Louisville Middle School, and Monarch High School.
Ownership History
Date
Name
Owned For
Owner Type
Purchase Details
Closed on
Sep 9, 2010
Sold by
222 Properties Llc
Bought by
607 Fireside Street Llc
Current Estimated Value
Purchase Details
Closed on
Sep 27, 1999
Sold by
Martien Charles P and Martien Leslie A
Bought by
222 Properties Llc
Purchase Details
Closed on
May 14, 1999
Sold by
Townsend Shields Barbara L and Townsend Linda J
Bought by
Martien Charles P
Home Financials for this Owner
Home Financials are based on the most recent Mortgage that was taken out on this home.
Original Mortgage
$128,000
Interest Rate
7.04%
Purchase Details
Closed on
Apr 18, 1990
Bought by
607 Fireside Street Llc
Purchase Details
Closed on
Mar 13, 1980
Bought by
607 Fireside Street Llc
Purchase Details
Closed on
Jan 28, 1980
Bought by
607 Fireside Street Llc
Create a Home Valuation Report for This Property
The Home Valuation Report is an in-depth analysis detailing your home's value as well as a comparison with similar homes in the area
Home Values in the Area
Average Home Value in this Area
Purchase History
| Date | Buyer | Sale Price | Title Company |
|---|---|---|---|
| 607 Fireside Street Llc | -- | None Available | |
| 222 Properties Llc | -- | None Available | |
| Martien Charles P | $161,400 | -- | |
| 607 Fireside Street Llc | -- | -- | |
| 607 Fireside Street Llc | $61,300 | -- | |
| 607 Fireside Street Llc | $61,400 | -- |
Source: Public Records
Mortgage History
| Date | Status | Borrower | Loan Amount |
|---|---|---|---|
| Previous Owner | Martien Charles P | $128,000 |
Source: Public Records
Tax History Compared to Growth
Tax History
| Year | Tax Paid | Tax Assessment Tax Assessment Total Assessment is a certain percentage of the fair market value that is determined by local assessors to be the total taxable value of land and additions on the property. | Land | Improvement |
|---|---|---|---|---|
| 2025 | $3,355 | $38,476 | $24,488 | $13,988 |
| 2024 | $3,355 | $38,476 | $24,488 | $13,988 |
| 2023 | $3,299 | $37,332 | $29,326 | $11,692 |
| 2022 | $3,101 | $32,220 | $23,241 | $8,979 |
| 2021 | $3,070 | $33,148 | $23,910 | $9,238 |
| 2020 | $2,938 | $31,389 | $18,805 | $12,584 |
| 2019 | $2,896 | $31,389 | $18,805 | $12,584 |
| 2018 | $2,464 | $27,583 | $9,720 | $17,863 |
| 2017 | $2,415 | $30,495 | $10,746 | $19,749 |
| 2016 | $2,170 | $24,668 | $12,020 | $12,648 |
| 2015 | $2,057 | $20,584 | $8,278 | $12,306 |
| 2014 | $1,760 | $20,584 | $8,278 | $12,306 |
Source: Public Records
Map
Nearby Homes
- 1851 Gallagher Ln
- 1610 Longs Peak Dr
- 419 Centennial Dr
- 1856 Kalel Ln
- 1612 Cottonwood Dr Unit 11W
- 1608 Cottonwood Dr Unit 11
- 1655 Main St
- 1615 Cottonwood Dr Unit 9
- 152 Pheasant Run
- 142 Pheasant Run
- 1524 Main St
- 253 W Cedar Way
- 215 Sunland St
- 338 Pheasant Run
- 2020 Highway 42
- 2040 Highway 42
- 1304 Snowberry Ln Unit 202
- 1304 Snowberry Ln Unit 103
- 1234 Jefferson Ave
- 1312 Snowberry Ln Unit 103
- 599 Fireside St
- 639 Fireside St
- 606 Sunnyside St
- 596 Sunnyside St
- 634 Sunnyside St
- 565 Fireside St
- 671 Fireside St
- 608 Fireside St
- 638 Fireside St
- 570 Sunnyside St
- 662 Sunnyside St
- 578 Fireside St
- 664 Fireside St
- 539 Fireside St
- 536 Sunnyside St
- 692 Sunnyside St
- 1908 Sunnyside Cir
- 540 Fireside St
- 690 Fireside St
- 509 Fireside St