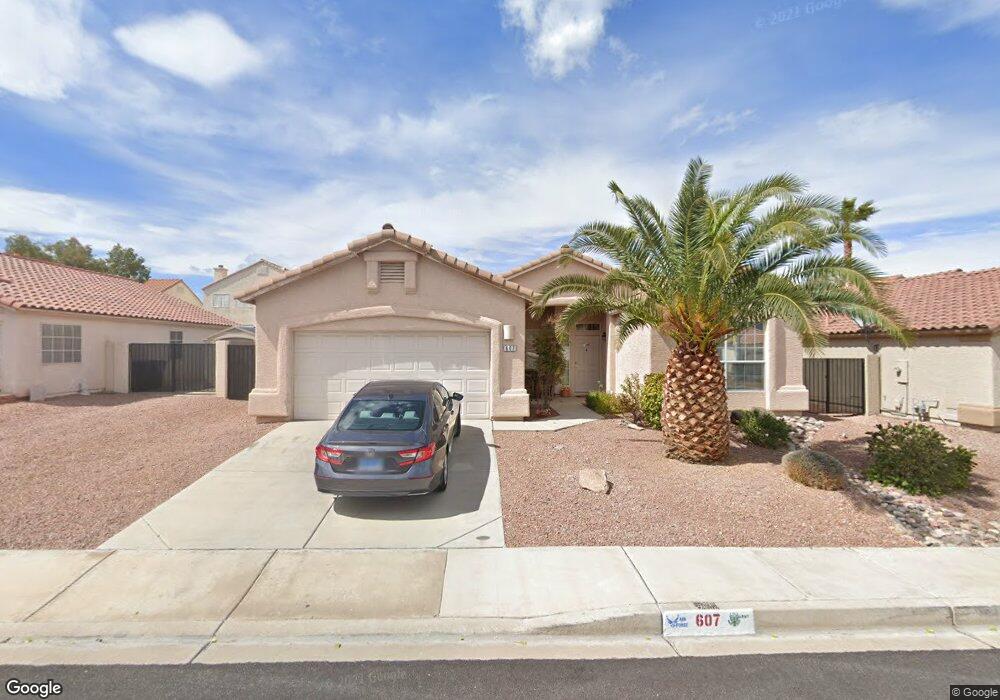
607 Fox Chase St Unit 2 Henderson, NV 89015
River Mountain NeighborhoodEstimated Value: $425,780 - $483,000
3
Beds
2
Baths
1,731
Sq Ft
$258/Sq Ft
Est. Value
About This Home
This home is located at 607 Fox Chase St Unit 2, Henderson, NV 89015 and is currently estimated at $445,945, approximately $257 per square foot. 607 Fox Chase St Unit 2 is a home located in Clark County with nearby schools including Sue H. Morrow Elementary School, B Mahlon Brown Academy of International Studies, and Basic Academy of International Studies.
Ownership History
Date
Name
Owned For
Owner Type
Purchase Details
Closed on
Dec 19, 2002
Sold by
Hud
Bought by
Aponte Peter and Aponte Maria
Current Estimated Value
Home Financials for this Owner
Home Financials are based on the most recent Mortgage that was taken out on this home.
Original Mortgage
$155,600
Outstanding Balance
$63,057
Interest Rate
5.96%
Estimated Equity
$382,888
Purchase Details
Closed on
Aug 1, 2002
Sold by
Chase Manhattan Mtg Corp
Bought by
Hud
Purchase Details
Closed on
Jul 25, 2002
Sold by
Black Stephen J and Black Carrie L
Bought by
Chase Manhattan Mtg Corp
Purchase Details
Closed on
Dec 30, 1997
Sold by
Pulte Homes Corp
Bought by
Black Stephen J and Black Carrie L
Home Financials for this Owner
Home Financials are based on the most recent Mortgage that was taken out on this home.
Original Mortgage
$123,364
Interest Rate
7.22%
Mortgage Type
FHA
Create a Home Valuation Report for This Property
The Home Valuation Report is an in-depth analysis detailing your home's value as well as a comparison with similar homes in the area
Home Values in the Area
Average Home Value in this Area
Purchase History
| Date | Buyer | Sale Price | Title Company |
|---|---|---|---|
| Aponte Peter | $155,600 | -- | |
| Hud | -- | First American Title Co | |
| Chase Manhattan Mtg Corp | $158,026 | First American Title Co | |
| Black Stephen J | $131,000 | First American Title Co |
Source: Public Records
Mortgage History
| Date | Status | Borrower | Loan Amount |
|---|---|---|---|
| Open | Aponte Peter | $155,600 | |
| Previous Owner | Black Stephen J | $123,364 |
Source: Public Records
Tax History
| Year | Tax Paid | Tax Assessment Tax Assessment Total Assessment is a certain percentage of the fair market value that is determined by local assessors to be the total taxable value of land and additions on the property. | Land | Improvement |
|---|---|---|---|---|
| 2026 | $1,643 | $98,795 | $37,100 | $61,695 |
| 2025 | $1,595 | $91,927 | $29,050 | $62,877 |
| 2024 | $1,549 | $91,927 | $29,050 | $62,877 |
| 2023 | $1,549 | $93,456 | $33,600 | $59,856 |
| 2022 | $1,504 | $81,998 | $27,300 | $54,698 |
| 2021 | $1,460 | $77,012 | $24,850 | $52,162 |
| 2020 | $1,414 | $76,671 | $24,850 | $51,821 |
| 2019 | $1,373 | $72,434 | $21,350 | $51,084 |
| 2018 | $1,333 | $66,400 | $17,150 | $49,250 |
| 2017 | $1,925 | $66,405 | $16,450 | $49,955 |
| 2016 | $1,263 | $58,861 | $8,750 | $50,111 |
| 2015 | $1,260 | $48,868 | $8,750 | $40,118 |
| 2014 | $1,223 | $40,968 | $8,050 | $32,918 |
Source: Public Records
Map
Nearby Homes
- 989 River Walk Ct
- 881 Dunkirk River Ct
- 994 River Walk Ct
- 999 Blue Lantern Dr
- 631 Fox Haven St
- 585 Preakness Stakes St Unit 2A
- 631 Pimlico Dr
- 1008 Beaver Crest Terrace
- 698 S Racetrack Rd Unit 1022
- 698 S Racetrack Rd Unit 1411
- 698 S Racetrack Rd Unit 1114
- 698 S Racetrack Rd Unit 1621
- 698 S Racetrack Rd Unit 713
- 596 Kenerly St
- 913 Dodee Ct
- 683 Harbor Mist Ave
- 840 Candido Garcia Ave
- 1001 Benton Ave
- 637 Bonsai Tree Ln
- 916 Twinkling Sky Ave
- 605 Fox Chase St
- 609 Fox Chase St Unit 2
- 606 Playa Del Sol Way
- 604 Playa Del Sol Way
- 603 Fox Chase St
- 608 Playa Del Sol Way
- 611 Fox Chase St
- 985 River Walk Ct
- 602 Playa Del Sol Way
- 604 Fox Chase St
- 613 Fox Chase St
- 601 Fox Chase St
- 987 River Walk Ct
- 602 Fox Chase St
- 984 Blue Lantern Dr
- 600 Playa Del Sol Way
- 612 Playa Del Sol Way Unit n/a
- 612 Playa Del Sol Way
- 600 Fox Chase St
- 914 Blanco Caballo Way
Your Personal Tour Guide
Ask me questions while you tour the home.