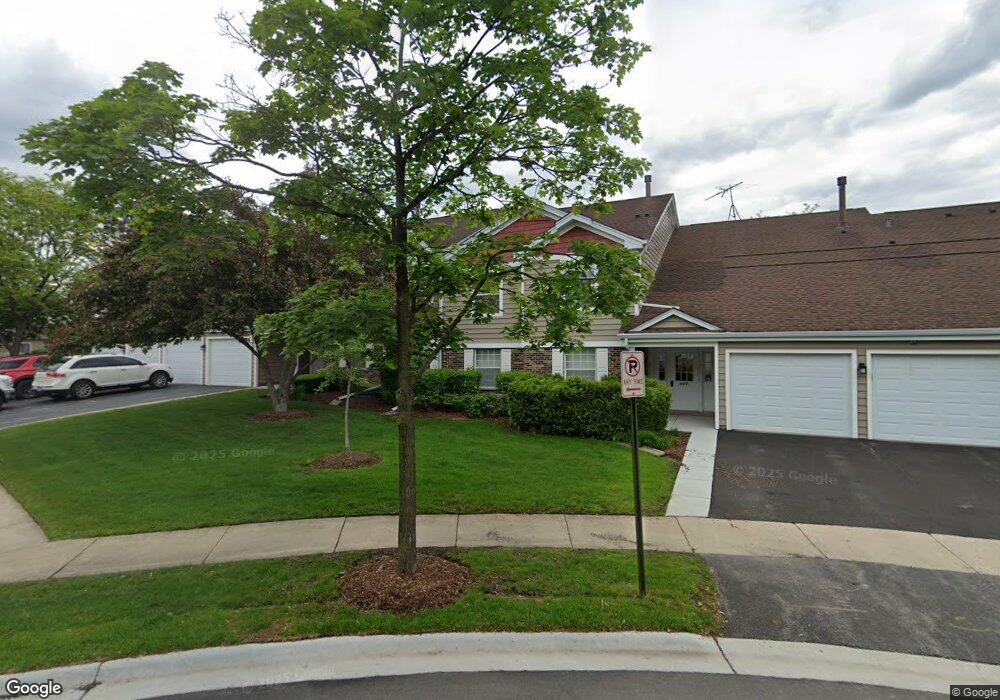
607 Hanover Ct Unit 1718R Schaumburg, IL 60194
East Schaumburg NeighborhoodEstimated Value: $236,000 - $299,000
2
Beds
--
Bath
1,200
Sq Ft
$230/Sq Ft
Est. Value
About This Home
This home is located at 607 Hanover Ct Unit 1718R, Schaumburg, IL 60194 and is currently estimated at $276,552, approximately $230 per square foot. 607 Hanover Ct Unit 1718R is a home located in Cook County with nearby schools including Everett Dirksen Elementary School, Robert Frost Junior High School, and J B Conant High School.
Ownership History
Date
Name
Owned For
Owner Type
Purchase Details
Closed on
Jun 14, 2017
Sold by
Cortez Kimi L and Cortez Salvador L
Bought by
Shuuayb Rana
Current Estimated Value
Purchase Details
Closed on
Aug 23, 2002
Sold by
Baus Diana
Bought by
Cortez Salvador L
Home Financials for this Owner
Home Financials are based on the most recent Mortgage that was taken out on this home.
Original Mortgage
$165,385
Interest Rate
6.24%
Mortgage Type
FHA
Purchase Details
Closed on
Oct 14, 2000
Sold by
Castner John M and Castner Kimberly S
Bought by
Baus Diana
Home Financials for this Owner
Home Financials are based on the most recent Mortgage that was taken out on this home.
Original Mortgage
$120,650
Interest Rate
7.9%
Purchase Details
Closed on
May 23, 1997
Sold by
Basciano Robert J
Bought by
Castner John M and Castner Kimberly S
Home Financials for this Owner
Home Financials are based on the most recent Mortgage that was taken out on this home.
Original Mortgage
$88,000
Interest Rate
8.13%
Create a Home Valuation Report for This Property
The Home Valuation Report is an in-depth analysis detailing your home's value as well as a comparison with similar homes in the area
Home Values in the Area
Average Home Value in this Area
Purchase History
| Date | Buyer | Sale Price | Title Company |
|---|---|---|---|
| Shuuayb Rana | $150,000 | Saturn Title Llc | |
| Cortez Salvador L | -- | -- | |
| Baus Diana | $127,000 | Lawyers Title Insurance Corp | |
| Castner John M | $110,000 | Attorneys Natl Title Network |
Source: Public Records
Mortgage History
| Date | Status | Borrower | Loan Amount |
|---|---|---|---|
| Previous Owner | Cortez Salvador L | $165,385 | |
| Previous Owner | Baus Diana | $120,650 | |
| Previous Owner | Castner John M | $88,000 |
Source: Public Records
Tax History Compared to Growth
Tax History
| Year | Tax Paid | Tax Assessment Tax Assessment Total Assessment is a certain percentage of the fair market value that is determined by local assessors to be the total taxable value of land and additions on the property. | Land | Improvement |
|---|---|---|---|---|
| 2024 | $5,062 | $18,071 | $5,557 | $12,514 |
| 2023 | $4,909 | $18,071 | $5,557 | $12,514 |
| 2022 | $4,909 | $18,071 | $5,557 | $12,514 |
| 2021 | $4,444 | $14,663 | $7,119 | $7,544 |
| 2020 | $4,368 | $14,663 | $7,119 | $7,544 |
| 2019 | $4,369 | $16,301 | $7,119 | $9,182 |
| 2018 | $3,593 | $11,972 | $5,991 | $5,981 |
| 2017 | $2,539 | $11,972 | $5,991 | $5,981 |
| 2016 | $2,617 | $11,972 | $5,991 | $5,981 |
| 2015 | $2,896 | $12,302 | $5,209 | $7,093 |
| 2014 | $2,880 | $12,302 | $5,209 | $7,093 |
| 2013 | $2,789 | $12,302 | $5,209 | $7,093 |
Source: Public Records
Map
Nearby Homes
- 601 Hanover Ct Unit Z2
- 602 Eastview Ct Unit Z1
- 600 Eastview Ct Unit X1
- 325 Bayview Point Unit 56B
- 751 Edgelake Point Unit 68C
- 121 Chatsworth Cir
- 22 Ascot Cir
- 28 Ascot Cir
- 85 Marble Hill Ct Unit A1
- 350 Newgate Ct Unit 2Z
- 223 Gareth Ln
- 91 Lambert Dr Unit B1
- 802 Stonewall Ct Unit 55
- 465 Apache Ln
- 287 Pembridge Ln Unit B2
- 147 Fulbright Ln
- 153 Fulbright Ln
- 22 Waterbury Ln Unit N1
- 705 Ash Rd
- 125 Cleveland Ct Unit M2
- 607 Hanover Ct Unit 1718R
- 607 Hanover Ct Unit 1718R
- 607 Hanover Ct Unit 1718R
- 607 Hanover Ct Unit V2
- 607 Hanover Ct Unit Z1
- 607 Hanover Ct Unit V1
- 609 Hanover Ct Unit W-2U
- 609 Hanover Ct Unit 1718L
- 609 Hanover Ct Unit 1718L
- 609 Hanover Ct Unit 1718L
- 609 Hanover Ct Unit 1718L
- 609 Hanover Ct Unit X1
- 609 Hanover Ct Unit W-2
- 609 Hanover Ct
- 610 Stone Circle Ct Unit V2
- 610 Stone Circle Ct Unit 171
- 610 Stone Circle Ct Unit 171
- 610 Stone Circle Ct Unit 171
- 610 Stone Circle Ct Unit 171
- 610 Stone Circle Ct Unit V1