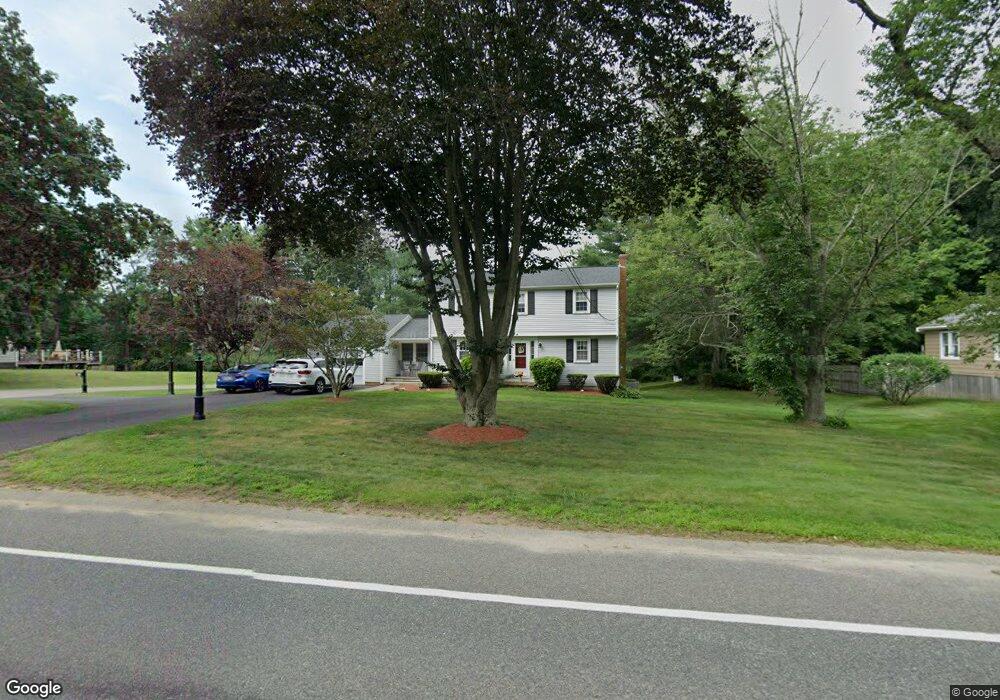
607 Indian Head St Hanson, MA 02341
Estimated Value: $617,007 - $749,000
4
Beds
2
Baths
1,774
Sq Ft
$388/Sq Ft
Est. Value
About This Home
This home is located at 607 Indian Head St, Hanson, MA 02341 and is currently estimated at $687,502, approximately $387 per square foot. 607 Indian Head St is a home located in Plymouth County.
Ownership History
Date
Name
Owned For
Owner Type
Purchase Details
Closed on
Feb 6, 2003
Sold by
Morrison David J and Morrison Christine L
Bought by
Polito Michael J and Polito Regina M
Current Estimated Value
Home Financials for this Owner
Home Financials are based on the most recent Mortgage that was taken out on this home.
Original Mortgage
$300,000
Interest Rate
5.99%
Mortgage Type
Purchase Money Mortgage
Purchase Details
Closed on
Jul 31, 1998
Sold by
Hennessey John F and Hennessey Cynthia B
Bought by
Morrison David J and Morrison Christine L
Purchase Details
Closed on
Oct 28, 1988
Sold by
Nelson Othilia P
Bought by
Hennessey John F
Create a Home Valuation Report for This Property
The Home Valuation Report is an in-depth analysis detailing your home's value as well as a comparison with similar homes in the area
Home Values in the Area
Average Home Value in this Area
Purchase History
| Date | Buyer | Sale Price | Title Company |
|---|---|---|---|
| Polito Michael J | $379,900 | -- | |
| Morrison David J | $209,000 | -- | |
| Hennessey John F | $155,000 | -- |
Source: Public Records
Mortgage History
| Date | Status | Borrower | Loan Amount |
|---|---|---|---|
| Open | Hennessey John F | $370,400 | |
| Closed | Hennessey John F | $300,000 | |
| Previous Owner | Hennessey John F | $10,000 |
Source: Public Records
Tax History Compared to Growth
Tax History
| Year | Tax Paid | Tax Assessment Tax Assessment Total Assessment is a certain percentage of the fair market value that is determined by local assessors to be the total taxable value of land and additions on the property. | Land | Improvement |
|---|---|---|---|---|
| 2025 | $6,797 | $508,000 | $163,900 | $344,100 |
| 2024 | $6,602 | $493,400 | $159,200 | $334,200 |
| 2023 | $6,445 | $454,500 | $159,200 | $295,300 |
| 2022 | $6,238 | $413,400 | $144,700 | $268,700 |
| 2021 | $5,516 | $365,300 | $139,200 | $226,100 |
| 2020 | $5,552 | $363,600 | $141,900 | $221,700 |
| 2019 | $5,296 | $341,000 | $139,200 | $201,800 |
| 2018 | $5,235 | $330,700 | $133,800 | $196,900 |
| 2017 | $5,077 | $317,700 | $127,500 | $190,200 |
| 2016 | $5,122 | $309,500 | $127,500 | $182,000 |
| 2015 | $4,857 | $305,100 | $127,500 | $177,600 |
Source: Public Records
Map
Nearby Homes
- 109 Richard Rd
- 438 Maquan St
- 52 Richard Rd
- Lot 6 Way
- Lot 2 Harvard Rd
- 145 Gorwin Dr
- 29 Bayberry Rd
- 161 Winter St Unit 24
- 269 Lakeside Rd
- 166 Pine Grove Ave
- 125 Independence Ave
- 42 Taylor Point Rd
- 456 Gorwin Dr
- 479 Main St
- 26 Stonebridge Dr
- 20 Carol Ave
- 38 Stonebridge Dr Unit 38
- 1054 Main St
- 80 Phillips St
- 72 Phillips St
- 617 Indian Head St
- 26 Indian Trail
- 585 Indian Head St
- 631 Indian Head St
- 594 Indian Head St
- 40 Indian Trail
- 612 Indian Head St
- 56 Indian Path
- 636 Indian Head St
- 571 Indian Head St
- 576 Indian Head St
- 651 Indian Head St
- 62 Indian Path
- 43 Indian Trail
- 48 Indian Path
- 51 Indian Path
- 658 Indian Head St
- 57 Indian Trail
- 671 Indian Head St
- 31 Indian Path