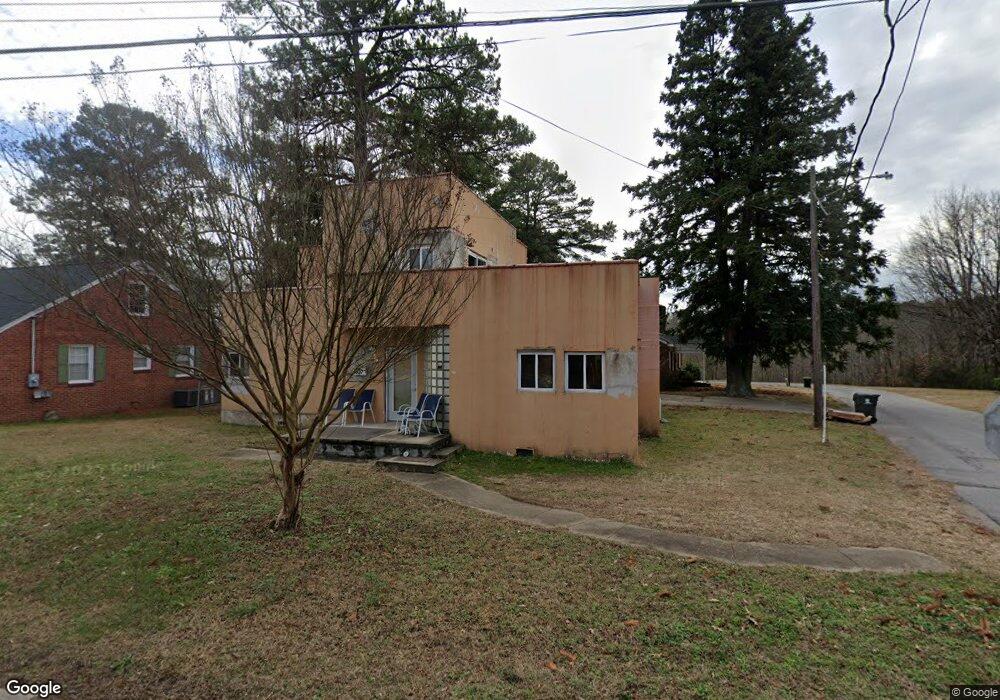
607 Julian R Allsbrook Hwy Weldon, NC 27890
Estimated Value: $50,000 - $77,000
3
Beds
2
Baths
1,240
Sq Ft
$50/Sq Ft
Est. Value
About This Home
This home is located at 607 Julian R Allsbrook Hwy, Weldon, NC 27890 and is currently estimated at $62,391, approximately $50 per square foot. 607 Julian R Allsbrook Hwy is a home located in Halifax County with nearby schools including Weldon Elementary Global Academy, Weldon Middle School, and Roanoke Valley Early College.
Ownership History
Date
Name
Owned For
Owner Type
Purchase Details
Closed on
Oct 25, 2016
Sold by
Coles Noland L and Cabot Myra
Bought by
Coles Noland L
Current Estimated Value
Purchase Details
Closed on
Dec 4, 2014
Sold by
Henderson Christopher R and Johnson Jacqueline S
Bought by
Vfs Lending Jv Ii Llc
Purchase Details
Closed on
Feb 18, 2013
Sold by
Ross Dozier Tonita and Dozier Clifford
Bought by
Henderson Christopher R and Johnson Jacqueline S
Home Financials for this Owner
Home Financials are based on the most recent Mortgage that was taken out on this home.
Original Mortgage
$24,300
Interest Rate
3.43%
Purchase Details
Closed on
Aug 3, 2010
Sold by
Wachovia Bank Na
Bought by
Ross Dozier Tonita
Purchase Details
Closed on
Nov 25, 2009
Sold by
Winstead Timothe and Winstead Debra D
Bought by
Wachovia Bank National Assn
Create a Home Valuation Report for This Property
The Home Valuation Report is an in-depth analysis detailing your home's value as well as a comparison with similar homes in the area
Home Values in the Area
Average Home Value in this Area
Purchase History
| Date | Buyer | Sale Price | Title Company |
|---|---|---|---|
| Coles Noland L | -- | None Available | |
| Vfs Lending Jv Ii Llc | $32,500 | None Available | |
| Henderson Christopher R | $2,700 | None Available | |
| Ross Dozier Tonita | $7,500 | -- | |
| Wachovia Bank National Assn | $33,000 | -- |
Source: Public Records
Mortgage History
| Date | Status | Borrower | Loan Amount |
|---|---|---|---|
| Previous Owner | Henderson Christopher R | $24,300 |
Source: Public Records
Tax History Compared to Growth
Tax History
| Year | Tax Paid | Tax Assessment Tax Assessment Total Assessment is a certain percentage of the fair market value that is determined by local assessors to be the total taxable value of land and additions on the property. | Land | Improvement |
|---|---|---|---|---|
| 2025 | $7 | $29,200 | $3,600 | $25,600 |
| 2024 | $7 | $29,200 | $3,600 | $25,600 |
| 2023 | $632 | $21,900 | $3,600 | $18,300 |
| 2022 | $611 | $21,900 | $3,600 | $18,300 |
| 2021 | $597 | $21,900 | $3,600 | $18,300 |
| 2020 | $605 | $21,900 | $3,600 | $18,300 |
| 2019 | $509 | $15,500 | $3,600 | $11,900 |
| 2018 | $510 | $15,600 | $3,600 | $12,000 |
| 2017 | $473 | $15,600 | $3,600 | $12,000 |
| 2016 | $501 | $15,600 | $3,600 | $12,000 |
| 2015 | $800 | $35,500 | $3,600 | $31,900 |
| 2014 | $1,118 | $60,570 | $5,150 | $55,420 |
Source: Public Records
Map
Nearby Homes
- 407 Brownell St
- 20 Acres Hwy 301
- 931 Washington Ave
- 1029 Washington Ave
- Tbd County Rd
- 0 Premier Blvd Unit 139882
- 1406 Elm St
- 0 Old Farm Rd
- Lot 88R Old Farm Rd
- 305 Rollingwood Rd
- 1515 4th Ave
- 228 Old Farm Rd
- 1511 4th Ave
- 104 Beechwood Dr
- 1507 4th Ave
- 104 Dunshill Rd
- 1501 4th Ave
- 764 Rivers Edge Pkwy
- 770 Rivers Edge Pkwy
- 772 Rivers Edge Pkwy