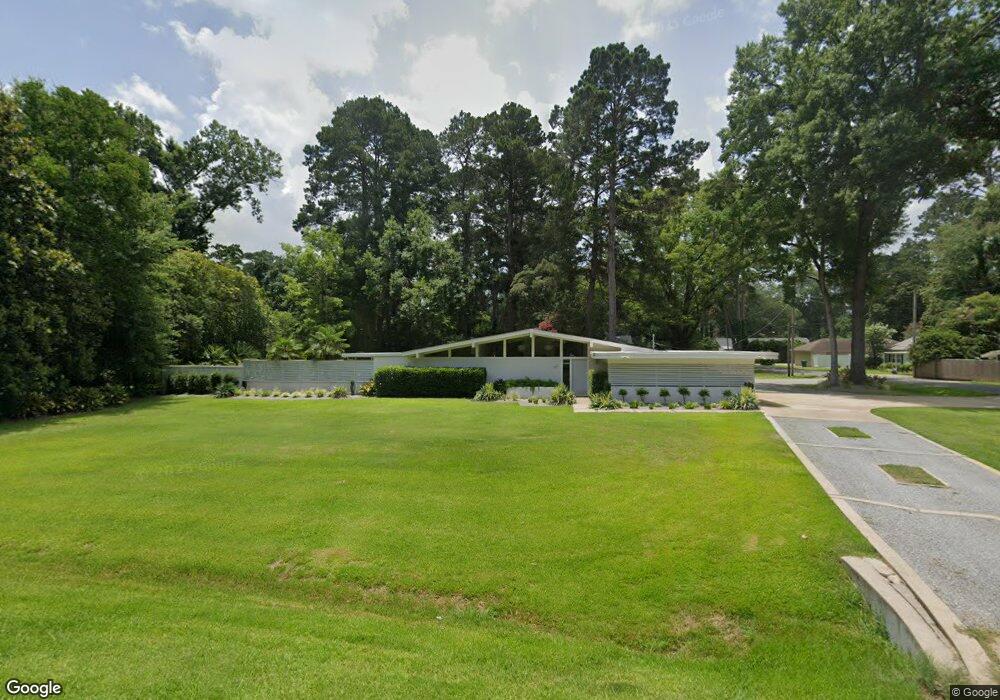
607 Loop Rd Monroe, LA 71201
North Monroe NeighborhoodEstimated Value: $260,182 - $418,000
2
Beds
2
Baths
1,903
Sq Ft
$168/Sq Ft
Est. Value
About This Home
This home is located at 607 Loop Rd, Monroe, LA 71201 and is currently estimated at $320,046, approximately $168 per square foot. 607 Loop Rd is a home with nearby schools including Lexington Elementary School, Sallie Humble Elementary School, and Neville Junior High School.
Ownership History
Date
Name
Owned For
Owner Type
Purchase Details
Closed on
Nov 1, 2017
Sold by
Braud Charlotte Pitts
Bought by
Braud Hud Heath and Braud Danna Brister
Current Estimated Value
Home Financials for this Owner
Home Financials are based on the most recent Mortgage that was taken out on this home.
Original Mortgage
$221,306
Interest Rate
4.4%
Mortgage Type
FHA
Purchase Details
Closed on
Apr 2, 2015
Sold by
Vanvechoven Donna Brister Weaver
Bought by
Braud Chrlotte Pitts
Home Financials for this Owner
Home Financials are based on the most recent Mortgage that was taken out on this home.
Original Mortgage
$225,834
Interest Rate
3.62%
Mortgage Type
FHA
Purchase Details
Closed on
Oct 31, 2014
Sold by
Eade Ellen R
Bought by
Vanveckhoven Donna Brister Weaver
Home Financials for this Owner
Home Financials are based on the most recent Mortgage that was taken out on this home.
Original Mortgage
$135,022
Interest Rate
4.25%
Mortgage Type
Future Advance Clause Open End Mortgage
Create a Home Valuation Report for This Property
The Home Valuation Report is an in-depth analysis detailing your home's value as well as a comparison with similar homes in the area
Home Values in the Area
Average Home Value in this Area
Purchase History
| Date | Buyer | Sale Price | Title Company |
|---|---|---|---|
| Braud Hud Heath | $290,000 | None Available | |
| Braud Chrlotte Pitts | $230,000 | None Available | |
| Vanveckhoven Donna Brister Weaver | -- | None Available |
Source: Public Records
Mortgage History
| Date | Status | Borrower | Loan Amount |
|---|---|---|---|
| Previous Owner | Braud Hud Heath | $221,306 | |
| Previous Owner | Braud Chrlotte Pitts | $225,834 | |
| Previous Owner | Vanveckhoven Donna Brister Weaver | $135,022 |
Source: Public Records
Tax History
| Year | Tax Paid | Tax Assessment Tax Assessment Total Assessment is a certain percentage of the fair market value that is determined by local assessors to be the total taxable value of land and additions on the property. | Land | Improvement |
|---|---|---|---|---|
| 2025 | $2,130 | $25,211 | $2,100 | $23,111 |
| 2024 | $2,130 | $25,211 | $2,100 | $23,111 |
| 2023 | $2,132 | $25,211 | $2,100 | $23,111 |
| 2022 | $2,218 | $20,959 | $2,813 | $18,146 |
| 2021 | $2,212 | $20,959 | $2,813 | $18,146 |
| 2020 | $2,212 | $20,959 | $2,813 | $18,146 |
| 2019 | $2,199 | $20,959 | $2,813 | $18,146 |
| 2018 | $2,202 | $20,959 | $2,813 | $18,146 |
| 2017 | $1,117 | $10,090 | $2,813 | $7,277 |
| 2016 | $1,117 | $10,090 | $2,813 | $7,277 |
| 2015 | $489 | $10,090 | $2,813 | $7,277 |
| 2014 | -- | $10,090 | $2,813 | $7,277 |
| 2013 | $489 | $10,090 | $2,813 | $7,277 |
Source: Public Records
Map
Nearby Homes
- 3111 River Oaks Dr
- 414 Frederick St
- 412 Frederick St
- 2901 Oliver Rd
- 2912 River Oaks Dr
- 304 Harn St
- 2610 Marquette St
- 2009 Lexington Ave
- 3105 W Deborah Dr
- 2718 Point Dr
- 2329 Sauvelle Dr
- 2110 Pargoud Blvd
- 2731 Bayou Ln
- 3201 Stowers Dr
- 2702 Cuba Blvd
- 3308 Stowers Dr
- 0 Pargoud Landing
- 2504 Pargoud Landing
- 2001 Pargoud Blvd
- 3115 Deborah Dr
- 2510 Chaucer Ave
- 701 Loop Rd
- 2611 Chaucer Ave
- 2506 Chaucer Ave
- 605 Loop Rd
- 2605 Chaucer Ave
- 2509 Spencer Ave
- 2507 Spencer Ave
- 620 Avoyelles St
- 612 Avoyelles St
- 705 Loop Rd
- 610 Avoyelles St
- 2606 Lexington Ave
- 606 Loop Rd
- 2604 Lexington Ave
- 604 Loop Rd
- 702 Avoyelles St
- 700 Avoyelles St
- 2602 Lexington Ave
- 603 Loop Rd
Your Personal Tour Guide
Ask me questions while you tour the home.