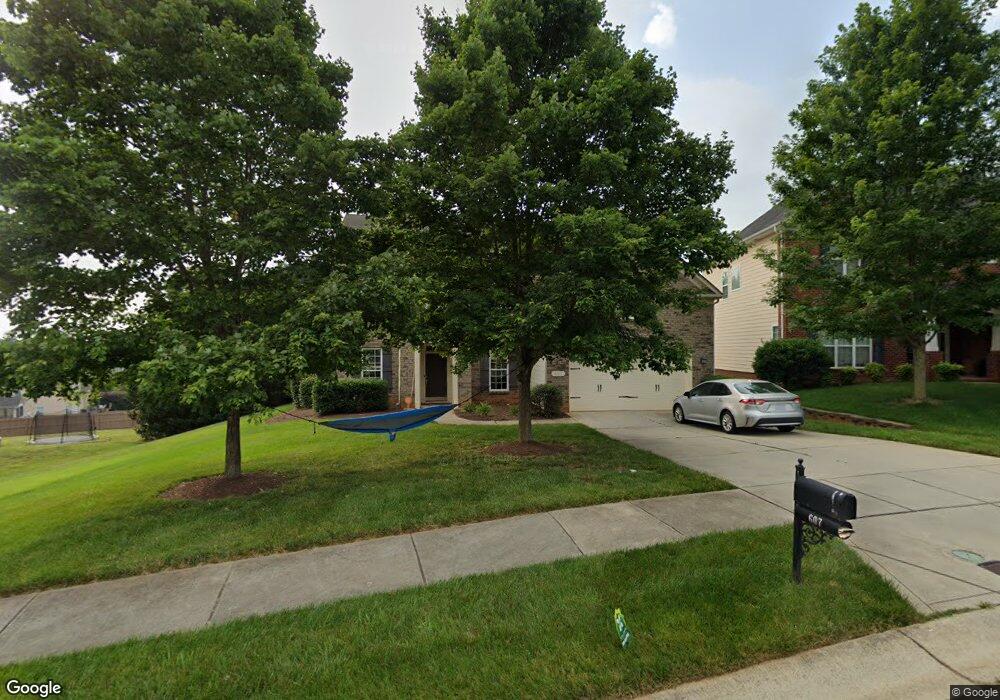
607 Lorain Ave NW Unit 416 Concord, NC 28027
Estimated Value: $585,000 - $623,000
5
Beds
4
Baths
2,946
Sq Ft
$206/Sq Ft
Est. Value
About This Home
This home is located at 607 Lorain Ave NW Unit 416, Concord, NC 28027 and is currently estimated at $607,454, approximately $206 per square foot. 607 Lorain Ave NW Unit 416 is a home located in Cabarrus County with nearby schools including Cox Mill Elementary School, Harold E. Winkler Middle School, and Cox Mill High School.
Ownership History
Date
Name
Owned For
Owner Type
Purchase Details
Closed on
Sep 1, 2018
Sold by
Plaisier Robert W and Plaisier Kara L
Bought by
Wojszczyk Bartosz K and Wojszezyk Kari A
Current Estimated Value
Home Financials for this Owner
Home Financials are based on the most recent Mortgage that was taken out on this home.
Original Mortgage
$332,500
Interest Rate
4.6%
Mortgage Type
New Conventional
Purchase Details
Closed on
Jul 7, 2016
Sold by
Foley Robert Francis and Foley Nicole A Scholand
Bought by
Plaisler Robert W and Plaisler Kara L
Purchase Details
Closed on
Aug 22, 2008
Sold by
Shea Homes Llc
Bought by
Foley Robert Francis and Foley Nicole A Scholand
Home Financials for this Owner
Home Financials are based on the most recent Mortgage that was taken out on this home.
Original Mortgage
$309,065
Interest Rate
6.32%
Mortgage Type
FHA
Create a Home Valuation Report for This Property
The Home Valuation Report is an in-depth analysis detailing your home's value as well as a comparison with similar homes in the area
Home Values in the Area
Average Home Value in this Area
Purchase History
| Date | Buyer | Sale Price | Title Company |
|---|---|---|---|
| Wojszczyk Bartosz K | $350,000 | None Available | |
| Plaisler Robert W | $320,000 | None Available | |
| Foley Robert Francis | $316,000 | None Available |
Source: Public Records
Mortgage History
| Date | Status | Borrower | Loan Amount |
|---|---|---|---|
| Previous Owner | Wojszczyk Bartosz K | $332,500 | |
| Previous Owner | Foley Robert Francis | $309,065 |
Source: Public Records
Tax History Compared to Growth
Tax History
| Year | Tax Paid | Tax Assessment Tax Assessment Total Assessment is a certain percentage of the fair market value that is determined by local assessors to be the total taxable value of land and additions on the property. | Land | Improvement |
|---|---|---|---|---|
| 2025 | $5,377 | $539,830 | $110,000 | $429,830 |
| 2024 | $5,377 | $539,830 | $110,000 | $429,830 |
| 2023 | $4,252 | $348,530 | $76,000 | $272,530 |
| 2022 | $4,252 | $348,530 | $76,000 | $272,530 |
| 2021 | $4,252 | $348,530 | $76,000 | $272,530 |
| 2020 | $4,252 | $348,530 | $76,000 | $272,530 |
| 2019 | $3,897 | $319,410 | $72,000 | $247,410 |
| 2018 | $3,833 | $319,410 | $72,000 | $247,410 |
| 2017 | $3,769 | $319,410 | $72,000 | $247,410 |
| 2016 | $2,068 | $259,170 | $60,000 | $199,170 |
| 2015 | $3,058 | $259,170 | $60,000 | $199,170 |
| 2014 | $3,058 | $259,170 | $60,000 | $199,170 |
Source: Public Records
Map
Nearby Homes
- 622 Lorain Ave NW
- 10205 Falling Leaf Dr NW
- 615 Vega St NW
- 10326 Lemmon Ave NW
- 10166 Falling Leaf Dr NW
- 10418 Goosefoot Ct NW
- 10620 Euclid Ave NW
- 11070 Discovery Dr NW
- 9586 Kartey Ave NW
- 11072 Discovery Dr NW
- 11044 Telegraph Rd NW
- 1309 Bedlington Dr NW
- 10341 Montrose Dr NW
- 9529 Numenore Dr
- 107 Northchase Dr
- 1086 MacAllum Dr NW
- 1458 Bedlington Dr NW
- 966 Parkland Place NW
- 1432 Bedlington Dr NW
- 1009 Brookline Dr
- 607 Lorain Ave NW
- 611 Lorain Ave NW
- 10299 Falling Leaf Dr NW
- 10295 Falling Leaf Dr NW
- 615 Lorain Ave NW
- 10291 Falling Leaf Dr NW
- 315 Sutro Forest Dr NW
- 307 Sutro Forest Dr NW
- 321 Sutro Forest Dr NW
- 301 Sutro Forest Dr NW
- 10303 Falling Leaf Dr NW
- 619 Lorain Ave NW
- 619 Lorain Ave NW Unit 413
- 329 Sutro Forest Dr NW
- 10287 Falling Leaf Dr NW
- 297 Sutro Forest Dr NW
- 616 Lorain Ave NW
- 10307 Falling Leaf Dr NW
- 623 Lorain Ave NW
- 293 Sutro Forest Dr NW