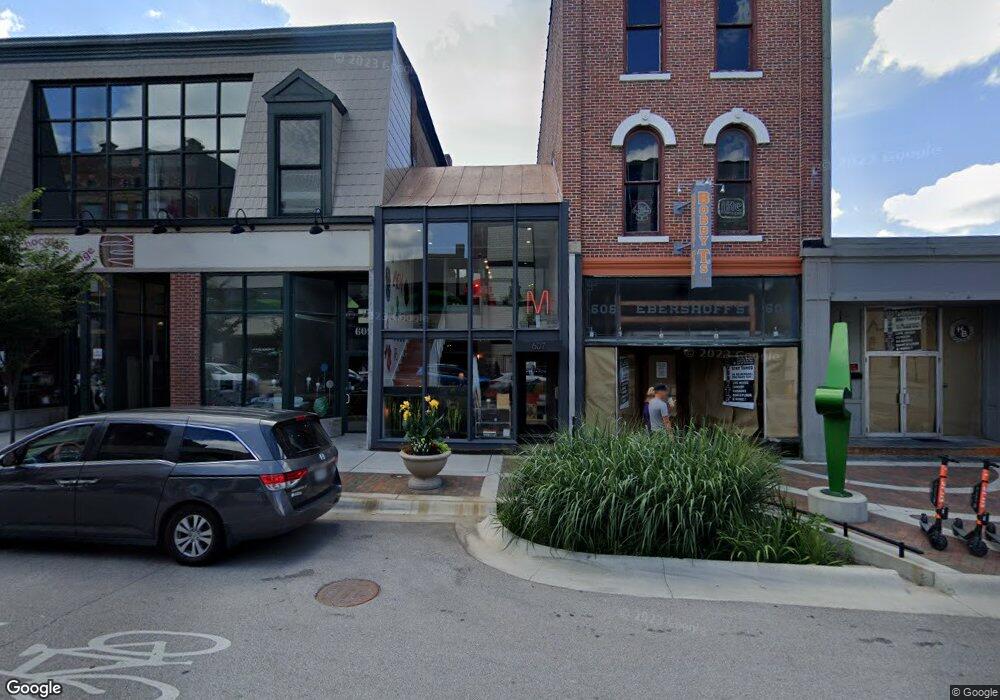
607 Main St La Fayette, IN 47901
Downtown NeighborhoodEstimated Value: $344,197
--
Bed
--
Bath
1,390
Sq Ft
$248/Sq Ft
Est. Value
About This Home
This home is located at 607 Main St, La Fayette, IN 47901 and is currently estimated at $344,197, approximately $247 per square foot. 607 Main St is a home located in Tippecanoe County with nearby schools including Thomas Miller Elementary School, Sunnyside Intermediate School, and Lafayette Tecumseh Junior High School.
Ownership History
Date
Name
Owned For
Owner Type
Purchase Details
Closed on
Dec 27, 2023
Sold by
Idearc Llc
Bought by
Molter Mark
Current Estimated Value
Home Financials for this Owner
Home Financials are based on the most recent Mortgage that was taken out on this home.
Original Mortgage
$232,500
Outstanding Balance
$223,523
Interest Rate
7.44%
Mortgage Type
Credit Line Revolving
Estimated Equity
$121,876
Purchase Details
Closed on
Apr 8, 2015
Sold by
900 Place Llc
Bought by
Idearc Llc
Home Financials for this Owner
Home Financials are based on the most recent Mortgage that was taken out on this home.
Original Mortgage
$114,700
Interest Rate
3.85%
Mortgage Type
New Conventional
Purchase Details
Closed on
Sep 15, 2003
Sold by
Home Tech Properties I Llc
Bought by
900 Place Llc
Purchase Details
Closed on
Jan 30, 2002
Sold by
Hood Melissa
Bought by
Hometech Properties I Llc
Purchase Details
Closed on
May 16, 2001
Sold by
Hometech Properties Ii Llc
Bought by
Hood Melissa
Create a Home Valuation Report for This Property
The Home Valuation Report is an in-depth analysis detailing your home's value as well as a comparison with similar homes in the area
Home Values in the Area
Average Home Value in this Area
Purchase History
| Date | Buyer | Sale Price | Title Company |
|---|---|---|---|
| Molter Mark | $310,000 | None Listed On Document | |
| Idearc Llc | -- | -- | |
| 900 Place Llc | -- | -- | |
| Hometech Properties I Llc | -- | -- | |
| Hood Melissa | -- | -- |
Source: Public Records
Mortgage History
| Date | Status | Borrower | Loan Amount |
|---|---|---|---|
| Open | Molter Mark | $232,500 | |
| Previous Owner | Idearc Llc | $114,700 |
Source: Public Records
Tax History Compared to Growth
Tax History
| Year | Tax Paid | Tax Assessment Tax Assessment Total Assessment is a certain percentage of the fair market value that is determined by local assessors to be the total taxable value of land and additions on the property. | Land | Improvement |
|---|---|---|---|---|
| 2024 | $7,777 | $278,000 | -- | $278,000 |
| 2023 | $2,541 | $107,000 | -- | $107,000 |
| 2022 | $2,684 | $104,400 | $0 | $104,400 |
| 2021 | $2,700 | $101,300 | $0 | $101,300 |
| 2020 | $2,690 | $101,200 | $0 | $101,200 |
| 2019 | $2,632 | $99,200 | $0 | $99,200 |
| 2018 | $2,578 | $96,900 | $0 | $96,900 |
| 2017 | $2,447 | $94,500 | $0 | $94,500 |
| 2016 | $2,389 | $94,000 | $0 | $94,000 |
| 2014 | $2,272 | $89,200 | $0 | $89,200 |
| 2013 | $2,209 | $87,700 | $0 | $87,700 |
Source: Public Records
Map
Nearby Homes
- 631 Main St
- 615 Main St
- 615 Main St
- 136 N 6th St Unit 2
- 136 N 6th St Unit 6
- 529 Main St
- 136 N 6th St Unit 8
- 136 N 6th St Unit 7
- 136 N 6th St Unit 6N
- 136 N 6th St Unit 5N
- 136 N 6th St Unit 4
- 136 N 6th St Unit 3
- 136 N 6th St Unit 2N
- 136 N 6th St Unit 1N
- 136 N 6th St Unit 5
- 136 N 6th St
- 136 N 6th St Unit 1
- 634 1/2 Main St
- 536 Main St
- 519 Main St