607 Morgan Ave Akron, OH 44311
South Akron NeighborhoodEstimated Value: $88,000 - $114,684
2
Beds
1
Bath
816
Sq Ft
$126/Sq Ft
Est. Value
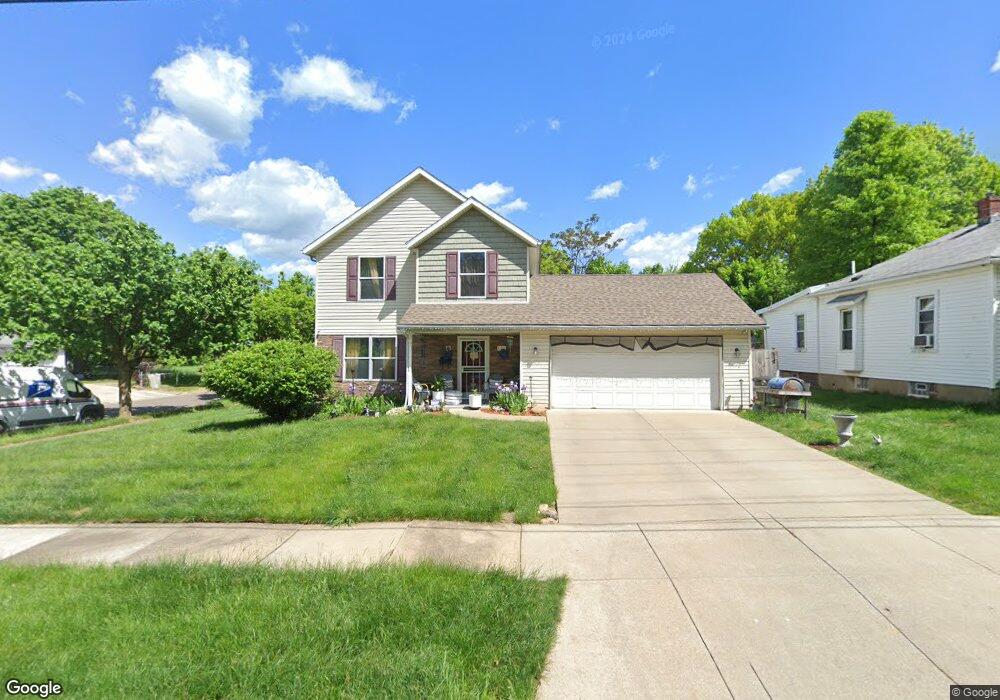
About This Home
This home is located at 607 Morgan Ave, Akron, OH 44311 and is currently estimated at $102,921, approximately $126 per square foot. 607 Morgan Ave is a home located in Summit County with nearby schools including Glover Community Learning Center, Kenmore Garfield Community Learning Center, and Main Preparatory Academy.
Ownership History
Date
Name
Owned For
Owner Type
Purchase Details
Closed on
May 20, 2011
Sold by
East Akron Neighborhood Development Corp
Bought by
Smith Shawn M
Current Estimated Value
Home Financials for this Owner
Home Financials are based on the most recent Mortgage that was taken out on this home.
Original Mortgage
$50,950
Outstanding Balance
$35,033
Interest Rate
4.96%
Mortgage Type
New Conventional
Estimated Equity
$67,888
Purchase Details
Closed on
Sep 10, 2010
Sold by
City Of Akron
Bought by
East Akron Neighborhood Development Corp
Purchase Details
Closed on
Feb 2, 2010
Sold by
Fannie Mae
Bought by
City Of Akron
Purchase Details
Closed on
Oct 1, 2009
Sold by
Csl Management Llc
Bought by
Federal National Mortgage Association
Purchase Details
Closed on
Feb 8, 2007
Sold by
Csl Management Llc
Bought by
Rettke Casey
Home Financials for this Owner
Home Financials are based on the most recent Mortgage that was taken out on this home.
Original Mortgage
$63,000
Interest Rate
6.22%
Mortgage Type
Purchase Money Mortgage
Purchase Details
Closed on
Feb 24, 2006
Sold by
Jpmorgan Chase Bank Na
Bought by
Csl Management Llc
Purchase Details
Closed on
Nov 7, 2005
Sold by
Thomas Raymond D
Bought by
Jpmorgan Chase Bank Na
Purchase Details
Closed on
Apr 16, 1999
Sold by
Property Investment Group Of Summit Coun
Bought by
Thomas Raymond D and Thomas Patricia J
Home Financials for this Owner
Home Financials are based on the most recent Mortgage that was taken out on this home.
Original Mortgage
$47,600
Interest Rate
7.17%
Create a Home Valuation Report for This Property
The Home Valuation Report is an in-depth analysis detailing your home's value as well as a comparison with similar homes in the area
Home Values in the Area
Average Home Value in this Area
Purchase History
| Date | Buyer | Sale Price | Title Company |
|---|---|---|---|
| Smith Shawn M | $76,000 | Minnesota Title | |
| East Akron Neighborhood Development Corp | -- | Minnesota Title | |
| City Of Akron | -- | Sovereign Title Agency Llc | |
| Federal National Mortgage Association | $36,000 | Attorney | |
| Rettke Casey | $70,000 | Attorney | |
| Csl Management Llc | $22,000 | Intitle Agency Inc | |
| Jpmorgan Chase Bank Na | $46,000 | None Available | |
| Thomas Raymond D | $43,000 | Guardian Title |
Source: Public Records
Mortgage History
| Date | Status | Borrower | Loan Amount |
|---|---|---|---|
| Open | Smith Shawn M | $50,950 | |
| Previous Owner | Rettke Casey | $63,000 | |
| Previous Owner | Thomas Raymond D | $47,600 |
Source: Public Records
Tax History
| Year | Tax Paid | Tax Assessment Tax Assessment Total Assessment is a certain percentage of the fair market value that is determined by local assessors to be the total taxable value of land and additions on the property. | Land | Improvement |
|---|---|---|---|---|
| 2024 | $1,495 | $24,326 | $5,226 | $19,100 |
| 2023 | $1,495 | $24,326 | $5,226 | $19,100 |
| 2022 | $1,182 | $14,308 | $3,073 | $11,235 |
| 2021 | $1,183 | $14,308 | $3,073 | $11,235 |
| 2020 | $1,168 | $14,310 | $3,070 | $11,240 |
| 2019 | $1,676 | $20,200 | $5,960 | $14,240 |
| 2018 | $1,656 | $20,200 | $5,960 | $14,240 |
| 2017 | $1,706 | $20,200 | $5,960 | $14,240 |
| 2016 | $1,707 | $20,570 | $5,960 | $14,610 |
| 2015 | $1,706 | $20,570 | $5,960 | $14,610 |
| 2014 | $1,694 | $20,570 | $5,960 | $14,610 |
| 2013 | $1,751 | $21,850 | $5,960 | $15,890 |
Source: Public Records
Map
Nearby Homes
Your Personal Tour Guide
Ask me questions while you tour the home.