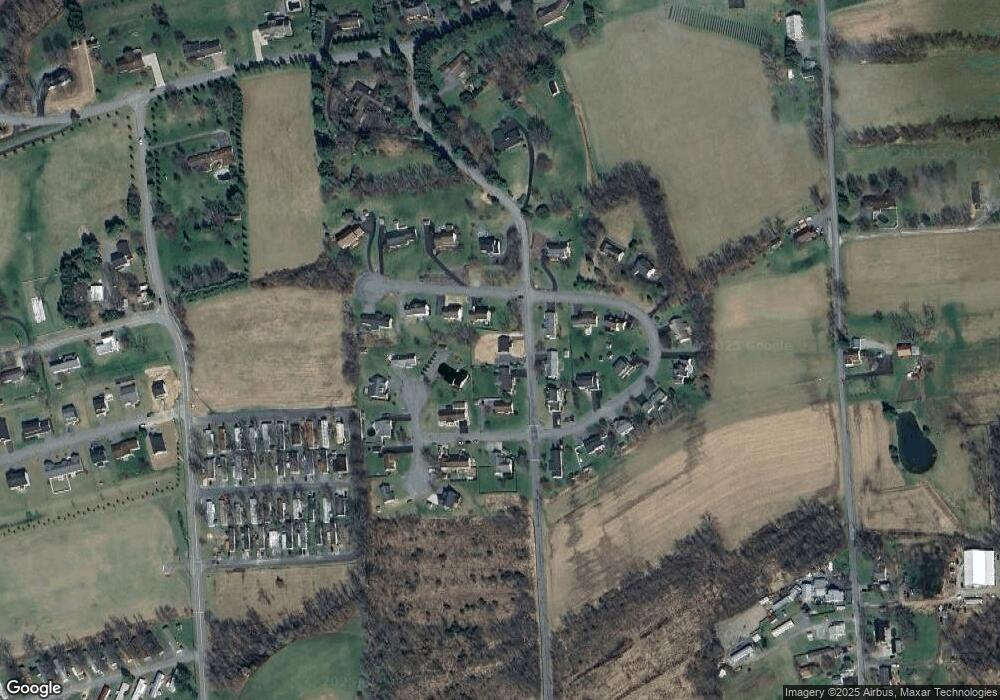
607 N 4th St Mifflinburg, PA 17844
Estimated Value: $202,000 - $355,000
2
Beds
2
Baths
1,260
Sq Ft
$202/Sq Ft
Est. Value
About This Home
This home is located at 607 N 4th St, Mifflinburg, PA 17844 and is currently estimated at $254,575, approximately $202 per square foot. 607 N 4th St is a home with nearby schools including Mifflinburg Elementary School, Mifflinburg Area Intermediate School, and Mifflinburg Area Middle School.
Ownership History
Date
Name
Owned For
Owner Type
Purchase Details
Closed on
Sep 19, 2023
Sold by
Designer Homes
Bought by
Macari Matthew and Macari Malanie
Current Estimated Value
Home Financials for this Owner
Home Financials are based on the most recent Mortgage that was taken out on this home.
Original Mortgage
$155,026
Outstanding Balance
$151,300
Interest Rate
6.75%
Mortgage Type
Construction
Estimated Equity
$103,275
Purchase Details
Closed on
May 10, 2022
Sold by
Mid State Holdings Llc
Bought by
Designer Homes
Purchase Details
Closed on
Jan 17, 2017
Sold by
Yoder Marlin E and Yoder Melanie S
Bought by
Mid State Holdings Llc
Purchase Details
Closed on
Mar 23, 2015
Sold by
Lemon Harris A and Lemon Barbara D
Bought by
Yoder Marlin E and Yoder Melanie S
Create a Home Valuation Report for This Property
The Home Valuation Report is an in-depth analysis detailing your home's value as well as a comparison with similar homes in the area
Home Values in the Area
Average Home Value in this Area
Purchase History
| Date | Buyer | Sale Price | Title Company |
|---|---|---|---|
| Macari Matthew | $51,500 | Quicksilva Title & Escrow | |
| Macari Matthew | $51,500 | Quicksilva Title & Escrow | |
| Macari Matthew | $51,500 | Quicksilva Title & Escrow | |
| Designer Homes | $51,500 | -- | |
| Mid State Holdings Llc | $25,000 | Attorney Only | |
| Mid State Holdings Llc | $25,000 | None Available | |
| Yoder Marlin E | $25,000 | None Available |
Source: Public Records
Mortgage History
| Date | Status | Borrower | Loan Amount |
|---|---|---|---|
| Open | Macari Matthew | $155,026 | |
| Closed | Macari Matthew | $155,026 |
Source: Public Records
Tax History Compared to Growth
Tax History
| Year | Tax Paid | Tax Assessment Tax Assessment Total Assessment is a certain percentage of the fair market value that is determined by local assessors to be the total taxable value of land and additions on the property. | Land | Improvement |
|---|---|---|---|---|
| 2025 | $2,255 | $113,900 | $21,000 | $92,900 |
| 2024 | $416 | $21,000 | $21,000 | $0 |
| 2023 | $402 | $21,000 | $21,000 | $0 |
| 2022 | $400 | $21,000 | $21,000 | $0 |
| 2021 | $396 | $21,000 | $21,000 | $0 |
| 2020 | $387 | $21,000 | $21,000 | $0 |
| 2019 | $380 | $21,000 | $21,000 | $0 |
| 2018 | $372 | $21,000 | $21,000 | $0 |
| 2017 | $364 | $21,000 | $21,000 | $0 |
Source: Public Records
Map
Nearby Homes